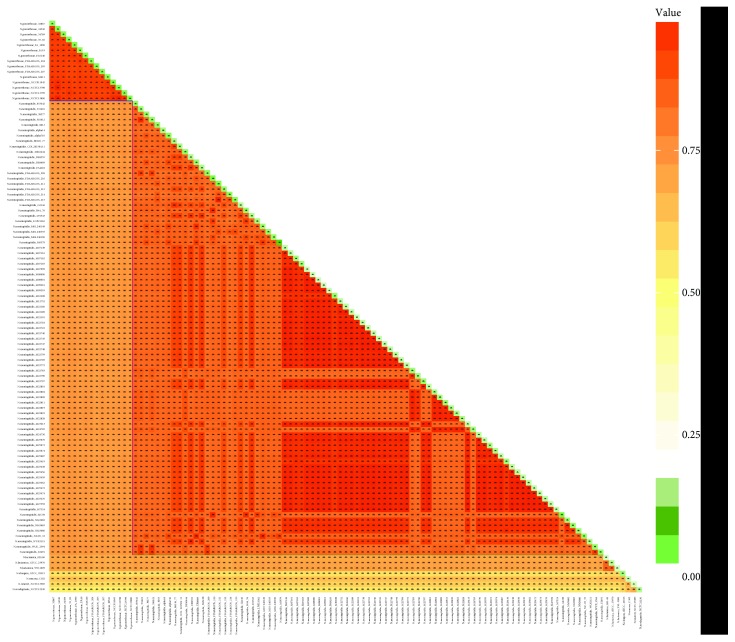
Figure 1.
Homologous proteome analysis between different strain proteomes (orthologous) and within a strain proteome (paralogous). The percentages of orthologous and paralogous proteins were represented by orange and green, respectively. The color depth corresponded to the size of homologous proportion. The ratios of homologous were shown in both corresponding boxes and Table S1.

