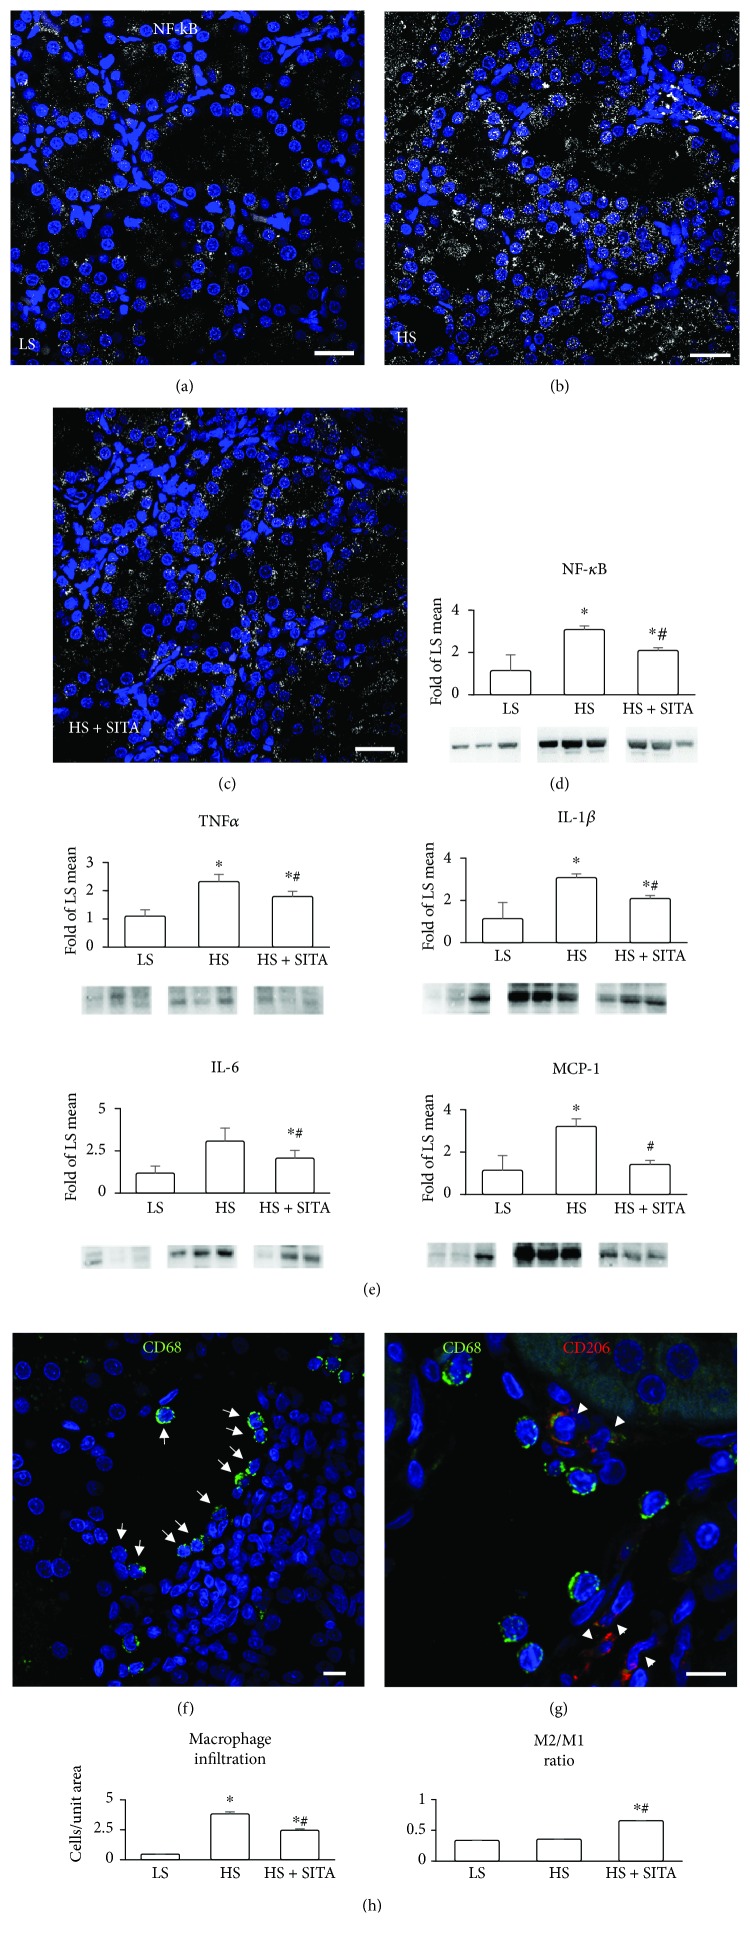
Figure 3.
Proinflammatory signaling and macrophage phenotype. (a–c) Immunofluorescence showing the expression of NF-κB (white, pseudocolor) in the tubules and interstitium in LS (a), HS (b), and HS + SITA (c) kidneys. (d) Protein expression of NF-κB by western blot. (e) Renal TNFα, IL-1β, IL-6, and MCP-1 protein levels. (f) Infiltration by macrophages labelled by CD68 (green, arrows) in the kidney of HS rat. (g) Macrophages of M2 subtype identified by the expression of CD206 (red, arrowheads) in the HS + SITA kidney. Nuclei are stained with DAPI (blue). (h) Numerical density of tissue macrophages and the fraction of M2 macrophage subpopulation. Scale bars: (a–c) 25 μm; (f, g) 10 μm. Data represent the mean ± SD. ∗P < 0.05 vs. LS; #P < 0.05 vs. HS.

