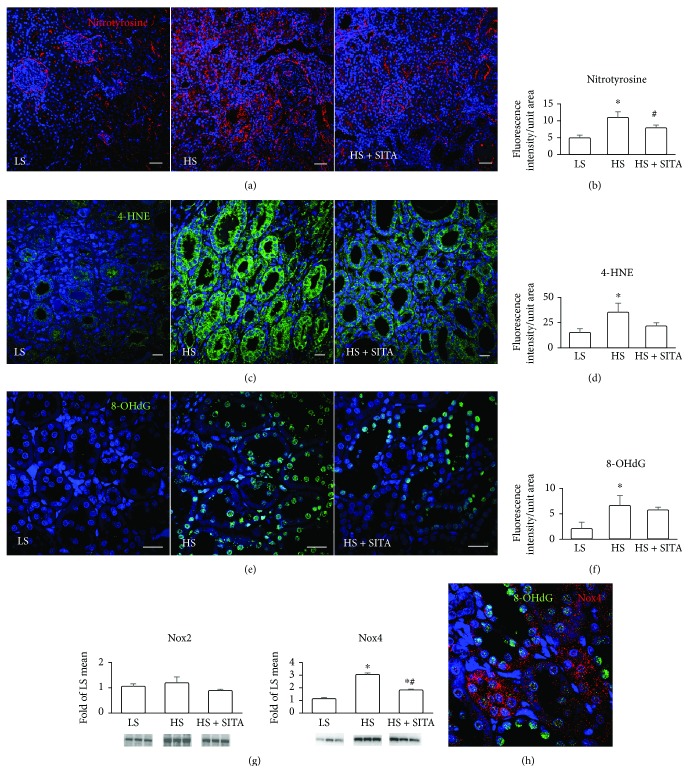
Figure 6.
Oxidative and nitrative stress. Detection and fluorescence quantification of nitrated proteins (nitrotyrosine, red) (a, b); oxidized lipids, 4-hydroxynonenal (4-HNE, green) (c, d); DNA, 8-hydroxydeoxyguanosine (8-OHdG, green) (e, f) in the kidneys of LS (left panels), HS (central panels), and HS + SITA (right panels) rats. (g) Protein expression of NADPH oxidase isoforms, Nox2 and Nox4. (h) Tubular epithelial cells expressing Nox4 (red) show oxidative injury of DNA (8-OHdG, green). Nuclei are stained with DAPI (blue). Scale bars: (a) 50 μm; (c, e, h) 20 μm. ∗P < 0.05 vs. LS; #P < 0.05 vs. HS.

