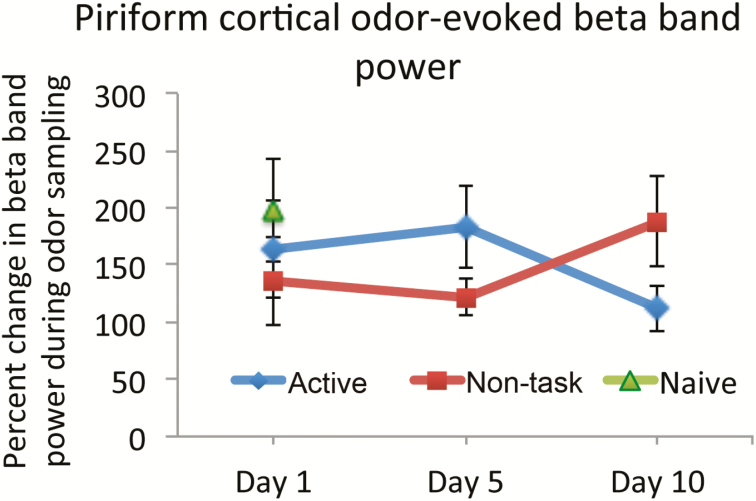
Figure 6.
Stimulus-evoked PCX LFP beta band power during odor sampling in the active-training task (active) (diamonds) and during tube investigation in the non-task-related home-cage exposure (non-task-related) (squares). Data from a separate group of naive mice that were not previously trained and were only exposed to the odors in their home cage is shown at Day 1 (triangle). Beta power is expressed as percent change from power during disengagement from the active-training task or during time not investigating the odorant tubes in the home cage. There was no significant difference in mean stimulus-evoked beta band power across days or stimulation paradigm. Error bars are ± SEM. This figure is reproduced in color in the online version of the issue.

