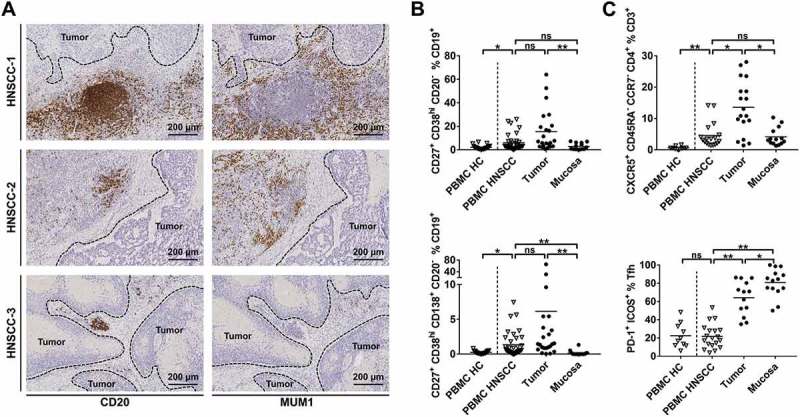
Figure 3.

TLS and phenotypes of lymphocytes involved in antigen-recognition and antibody-production in HNSCC.
Single cell suspensions from HNSCC tumor tissue (n = 38), non-cancerous mucosa (n = 14), PBMCs from HNSCC patients (PBMC HNSCC, n = 38) and healthy controls (PBMC HC, n = 20 for B cell subsets; n = 10 for T cell subsets) were analyzed by flow cytometry regarding B and T cell related surface antigens. (A) Exemplary immunohistochemical stainings of CD20 (left column) and MUM1 (right column) demonstrate tertiary lymphoid structures and a different degree of surrounding plasmacells. Each row contains consecutive sections of a HNSCC stained with CD20 antibody (left) and MUM1 antibody (right). (B) The percentage of plasmablast (upper plot) and plasma cell (lower plot) subpopulations is shown in scatter plots. (C) T follicular helper cells (CXCR5+/CD45RA−/CCR7−/CD4+) in percent of T cells in different compartments are displayed in the upper plot, the lower plot shows the percentage of PD-1+/ICOS+ Tfh. For statistical analysis, Kruskal-Wallis test was performed in (B) and upper plot of (C), one-way ANOVA was performed in lower plot of (C). Data is presented as mean. *P < 0.05; **P < 0.005; ns, not significant.
