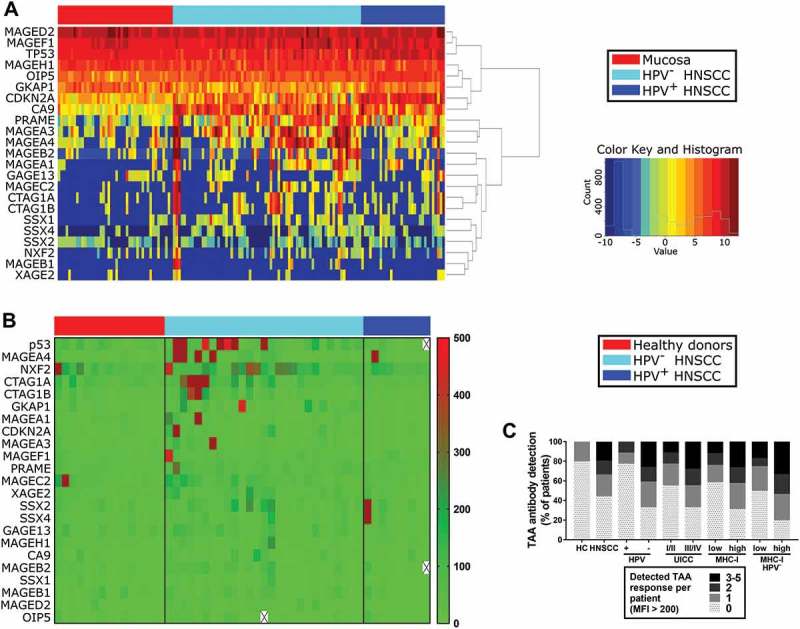
Figure 4.

Gene expression of TAAs in HNSCC/mucosa and serological detection of TAA-specific antibodies in HNSCC patients and healthy donors.
(A) Gene expression data of 23 different TAAs was obtained from TCGA HNSCC samples and is summarized in a heatmap. Results from non-cancerous mucosa are displayed on the left (n = 44), followed by HPV− (n = 72) and HPV+ (n = 32) HNSCC color-coded as indicated in the legend on the right. (B) Serological antibodies against 23 TAAs were measured by Luminex bead assay. Respective MFI levels are shown in a heatmap (color code on right side). Samples obtained from healthy donors (n = 15; left) were compared to HNSCC patient derived serum samples (HPV−, n = 27; middle; HPV+, n = 9; right). (C) TAA antibody detection is summarized in stacked graphs, comparing healthy controls (HC) with HNSCC patients on the left and stratifying data from HNSCC patients according to HPV status, disease stage (UICC) and MHC-I expression level of respective primary tumors. Positive results with TAA-specific MFI levels > 200 per patient were summed up. Antibodies against none up to a maximum of five TAAs were detected in single subjects.
