
Figure 2.
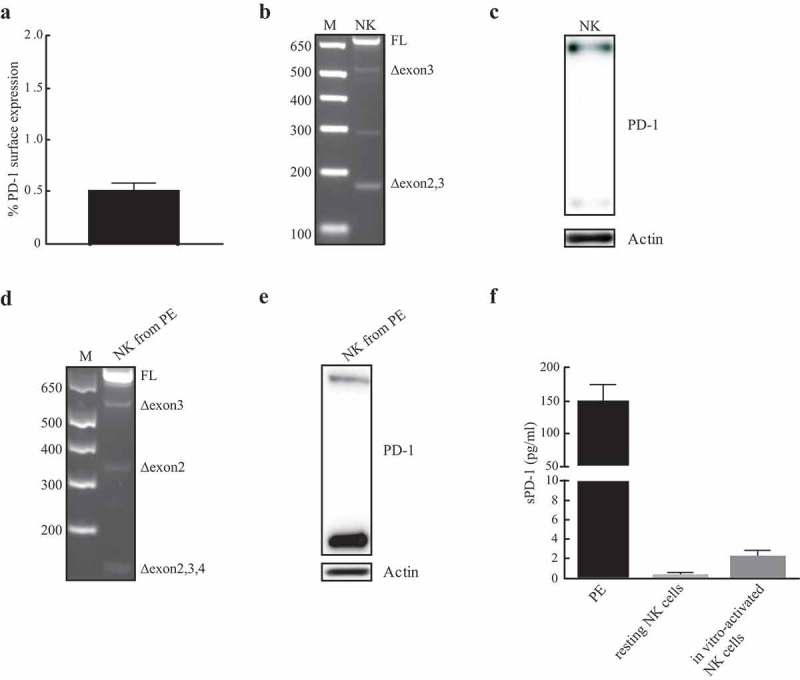
Detection of PD-1 mRNA isoforms and protein in IL-2 activated NK cells and in NK cells isolated from malignant PE. (a) Percentages of PD-1 surface expression in in vitro-activated NK cells isolated from HDs. (b) Analysis of PD-1 mRNA isoforms on NK cells. One representative HD, out of three analyzed, has been reported. (c) Total protein extracts isolated from in vitro-activated NK cells were analyzed for PD-1 expression. (d) Analysis of PD-1 splicing variants in NK from PE. (e) PD-1 protein profile of PE infiltrating NK cells. (f) sPD-1 has been studied in PE or supernatants (SN) of both resting and IL-2-activated NK cells isolated from HDs. Data for PE and HDs are relative to four and three different samples, respectively. sPD-1 concentration (pg/ml) has been calculated by use of a four-point-fit calibration curve of the standard dilutions.