
Figure 3.
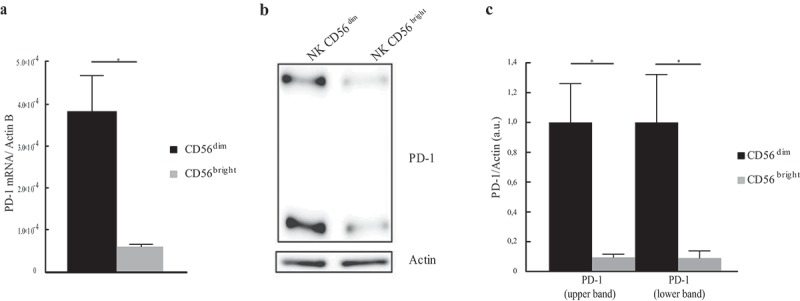
Different PD-1 mRNA and protein expression in CD56dim and CD56bright subsets. (a) PD-1 mRNA expression in sorted CD56dim (black column) and CD56bright (gray column) cells. PD-1 mRNA level was evaluated by RT-PCR amplification and normalized over Actin. Values, relative to three independent experiments are mean ± SEM. Statistical significance has been calculated by unpaired t-Test. (b) PD-1 protein expression in CD56dim and CD56bright NK subsets. A representative image from three independent experiments has been reported. (c) PD-1 protein quantification in CD56bright and CD56dim cells from three independents experiments. PD-1 values, normalized over Actin, are mean ± SEM and represent the PD-1 fold change calculated as a ratio between CD56bright and CD56dim cells. Statistical significance has been determined by unpaired t-Test.