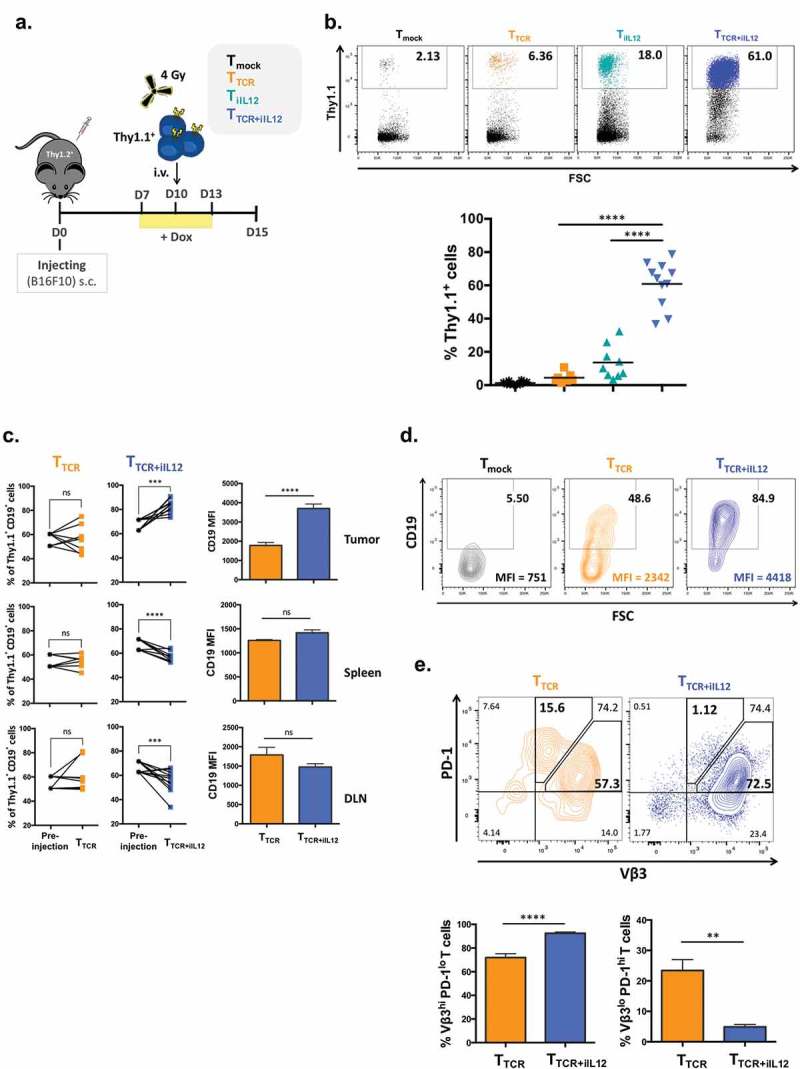
Figure 2.

Temporal induction of IL-12 in TCR-engineered T cells increases the numbers of T cells in the tumor and prevents PD-1 upregulation.
(a) Experimental setup. C57BL/6 female mice (Thy1.2+) were inoculated subcutaneously with 5 × 10⁵ B16 melanoma cells. 10 days later, mice were sublethally irradiated with 4Gy TBI 3-4hrs prior receiving intravenous injection of 2 × 10⁶ T cells (Thy1.1+) that were transduced with TRP2-TCR (TTCR), Tet-IL-12 (TiIL-12), TRP2-TCR + Tet-IL-12 (TTCR+iIL-12), or mock-transduced T cells (Tmock). All mice received Dox (2mg/ml) in drinking water 2–3 days prior receiving T cell infusion and kept on Dox water for another 3 days. Tumors, spleens and lymph nodes were harvested on day 5 after the adoptive transfer and analyzed by flow cytometry. (b) Representative dot plots showing the percentage of transferred cells (Thy1.1+) (top) and pooled summary data (bottom). Cells were pre-gated on live-singlet lymphocytes. Symbols represent individual mice and bars indicate group averages. P values: TTCR versus TTCR+iIL-12 transduced cells and TiIL-12 versus TTCR+iIL-12 transduced cells; p < 0.0001. (c) Relative accumulation of TCR-expressing cells (CD19+) in tumor, spleen and draining lymph nodes (DLN) 5 days post T cell transfer. Cells were pre-gated on live-singlet transferred Thy1.1+ T cells. Data shown are cumulative results from at least two independent experiments. P values for the frequency of TCR+ cells: TTCR versus pre-injection in the tumor, spleen and DLN; p > 0.05, TTCR+iIL-12 versus pre-injection in the tumor; p = 0.0010, spleen; p = 0.0020 and DLN; p = 0.0049. P values for CD19 MFI: TTCR versus TTCR+iIL-12 in the tumor; p < 0.0001, spleen and DLN; p > 0.05. Symbols represent individual mice (TTCR, n = 8 and TTCR+iIL-12, n = 11). (d) Representative flow cytometry plots depicting the percentage of TCR-expressing cells (CD19+) and mean fluorescence intensity (MFI) of CD19 within the adoptively transferred Thy1.1+ T cells. Cells were pre-gated on live-singlet lymphocytes. (e) Representative flow cytometry plots depicting PD-1 staining profile of TCR-expressing cells (Vβ3+) in the tumor which divided them into two populations: Vβ3hi PD-1lo and Vβ3lo PD-1hi T cells (top) and bar charts representing summary data pooled from two independent experiments (bottom). P values: percentage of Vβ3hi PD-1lo T cells in TTCR versus TTCR+iIL-12; p < 0.0001, percentage of Vβ3lo PD-1hi T cells in TTCR versus TTCR+iIL-12; p = 0.0011.
