Figure 1.

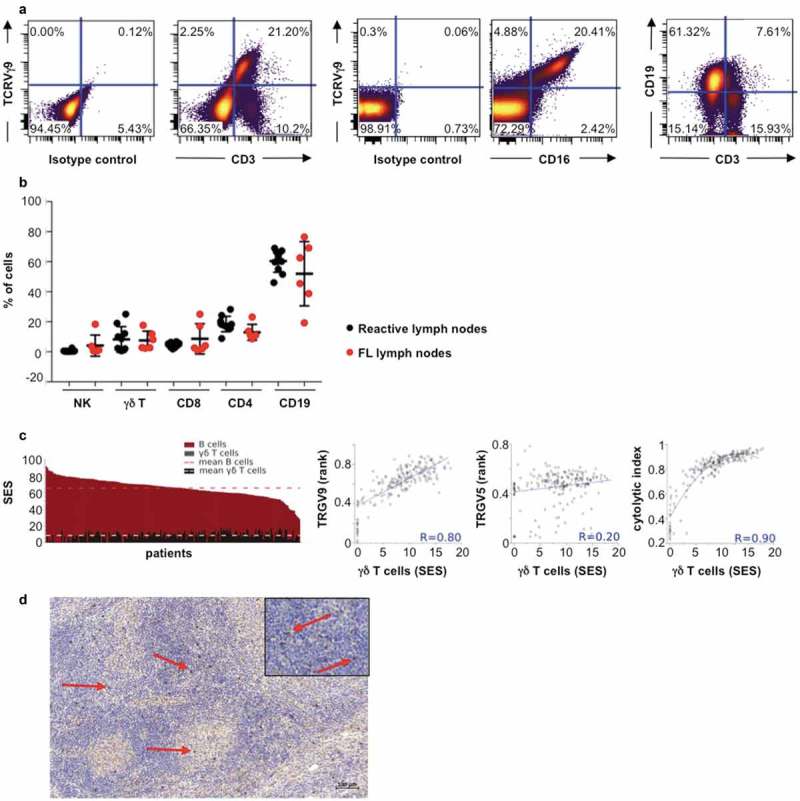
TCRVγ9Vδ2 T cells in FL lymph node biopsies. (a) Representative dot plots of γδ T cells (TCRVγ9+/CD3+), B cells (CD19+/CD3−), and TCRVγ9+/CD16+ cells. (b) Quantification of total B, γδ T, NK (CD3−CD56+) cells, CD4+ and CD8+ lymphocytes from healthy tonsils (black circle, n = 10) and FL lymph nodes (red circle, n = 10). (c) Sample enrichment scores (SES) of different cells subtypes in 198 FL patients and correlation of “γδ T-cell” SES with expression levels of the TRGV9 and TRGV5 genes, and the cytolytic index. (d) Representative section from FL lymph node showing TCR gamma chain staining (red arrow) (bar = 100µm); original magnification x100; zoom insert: original magnification x400).
