
Figure 4.
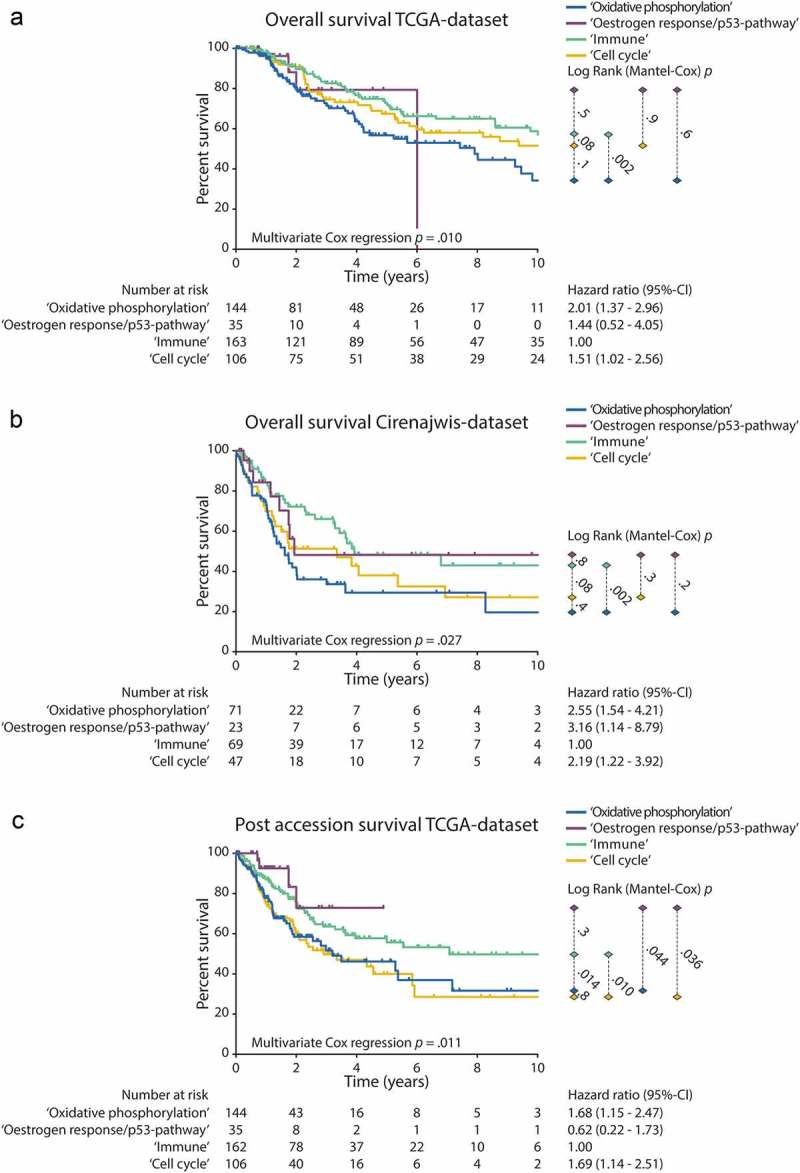
Survival analysis. Kaplan Meier curves are shown for each subclass. The p-values right from the curves illustrate the difference between individual curves, as calculated with the Log Rank (Mantel-Cox)-test. The hazard-ratios and 95%-confidence intervals of the multivariate cox-regression analysis for the association between subclass assignment with survival are shown right from the number at risk table. In each analysis, the ‘Immune’ subclass was selected as the reference group. Covariates in the multivariate cox regression analysis were: Gender, Age and Tumour stage. (a) OS in the TCGA-dataset. (b) OS in the Cirenajwis-dataset. (c) Post accession survival in the TCGA-dataset.