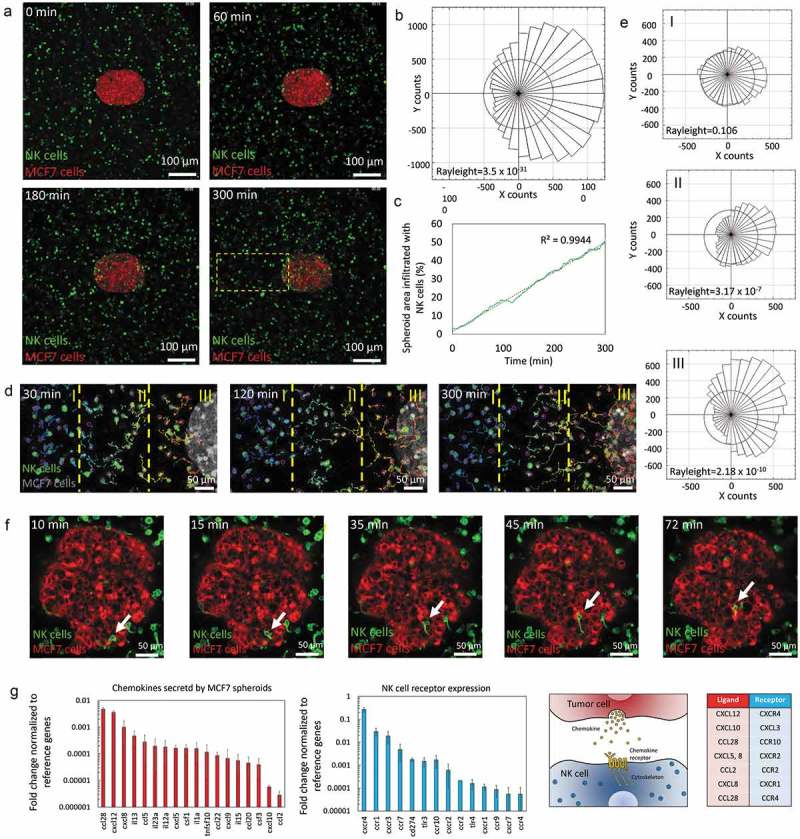
Figure 3.

NK-92 directional migration towards MCF7 spheroid. (a) 5 hours time-lapse experiment showing NK-92 (labeled in green) migration towards the MCF7 spheroid (labeled in red). (b) Rose diagram shows the directionality of the NK-92 cell trajectories. (c) Graph indicating the area within the MCF7 cell spheroid occupied by NK-92 cells. NK-92 cell penetration into the spheroid followed a linear dynamic during the experiment. (d) Chemotaxis analysis of a sub-section of the images showed in “A”. The field of view was divided in three regions: distal (I), central (II) and proximal (III) and NK cell migration was analyzed. (e) The rose diagrams indicate the different chemotaxis observed in the three different regions (I, II and III), demonstrating the chemotactic response was more intense the closer to the spheroid the cells were located. (f) NK-92 cells were able to migrate within the sphere using an ameboid movement (white arrow), squeezing through the spaces between tumor cells. (g) The expression of different chemokines secreted by the MCF7 spheroid was analyzed by q-PCR. The expression of multiple chemokine receptors was also analyzed in NK-92 cells. Gene expression was normalized to the reference genes. Chemokine-Receptor matching pairs found in the system are shown in the table.
