
Figure 3.
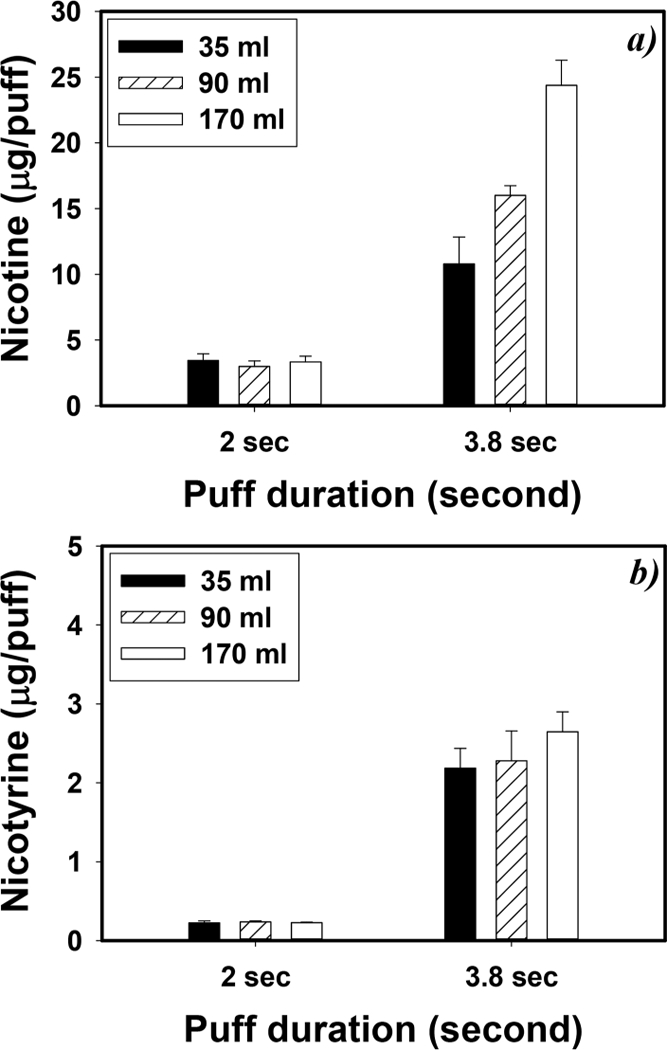
Impact of vaping topographies on (a) nicotine and (b) nicotyrine concentrations. E-vapors were generated under 6.4 W power output and 24 s puff interval with VG-based e-liquid with 12 mg/mL nicotine (n = 5, and error bars are standard deviations of 5 independent measurements)