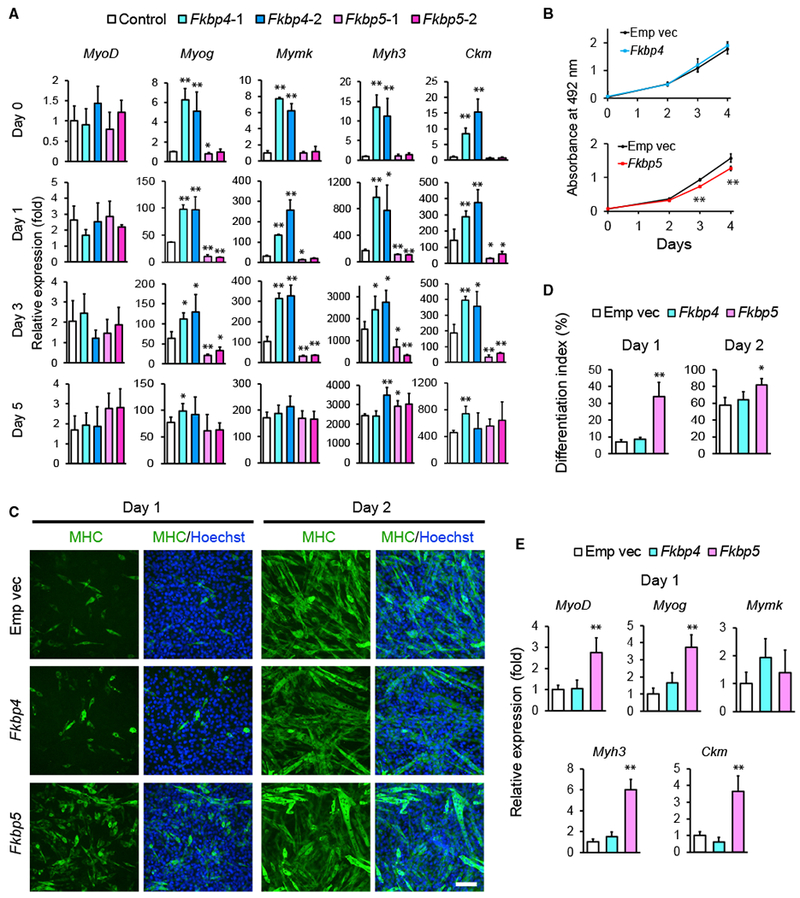
Figure 3. Differentiation of C2C12 Cells after KD or Overexpression of Fkbp4 and Fkbp5.

(A) qRT-PCR results comparing the expression levels of indicated muscle genes during differentiation of KD cells. The value obtained with the control on day 0 was defined as 1.0.
(B) MTS assay for the proliferation of undifferentiated cells after overexpression of Fkbp4 and Fkbp5. Empty vector (Emp vec) was transduced as the control.
(C) MHC staining of C2C12 cells overexpressing Fkbp4 and Fkbp5 during differentiation. Scale bar, 100 μm.
(D) The differentiation index of the overexpressing cells on day 1 and day 2 obtained from the observation of 1,000 nuclei.
(E) Relative expression levels of muscle genes determined by qRT-PCR on day 1. The value obtained with the control cells was defined as 1.0.
*p < 0.05 and **p < 0.01 with Student’s t test in comparison to the control cells. Data are presented as mean + or ± SD of technical triplicates.
