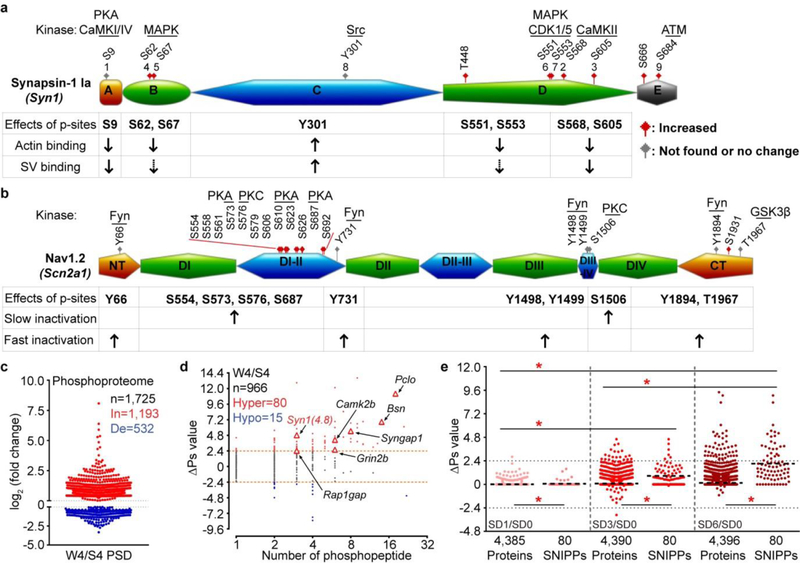
Extended Data Figure 6 |. Examples of cumulative phosphorylation of SNIPPs and synaptic phosphoproteomic analysis of normal sleep-wake model.
a-b, A schematic diagram of the domain structure of Synapsin-122 (a) and Nav1.223,41,42 (b) that summarizes known phosphorylation sites, kinases and physiological functions. Synapsin-1 can be divided into five domains (domain A-E). Nav1.2 can be divided into cytoplasmic N-terminal (NT), C-terminal (CT), four homologous transmembrane domains (DI-DIV) and intracellular loops (DI-II, DII-III, DIII-IV). Amino acid numbers refer to the sequence of mouse proteins. Sites 1–9 of Synapsin-1 are designated according to the consensus in the literature. While undetected or unchanged phosophorylation sites are labeled in grey, significantly increased phosphorylation sites are in red. Dashed arrows indicate the presence of contrasting data for biological functions in the literature. c, Published forebrain PSD phosphoproteome results [Diering et al. TableS2]4 were used for comparative analysis between normal slept (S4) and wake (W4) brains. d, Global ∆Ps analysis of all identified phosphoproteins in the W4/S4 group. Dotted lines (∆Ps = +/−2.4). e, Quantitative ∆Ps analysis of SD1/SD0, SD3/SD0, SD6/SD0 groups. Mean; one-way ANOVA, Tukey’s (Total, SNIPPs); Unpaired t-test, two-tailed (Total vs. SNIPPs). *(red) P < 0.001.

