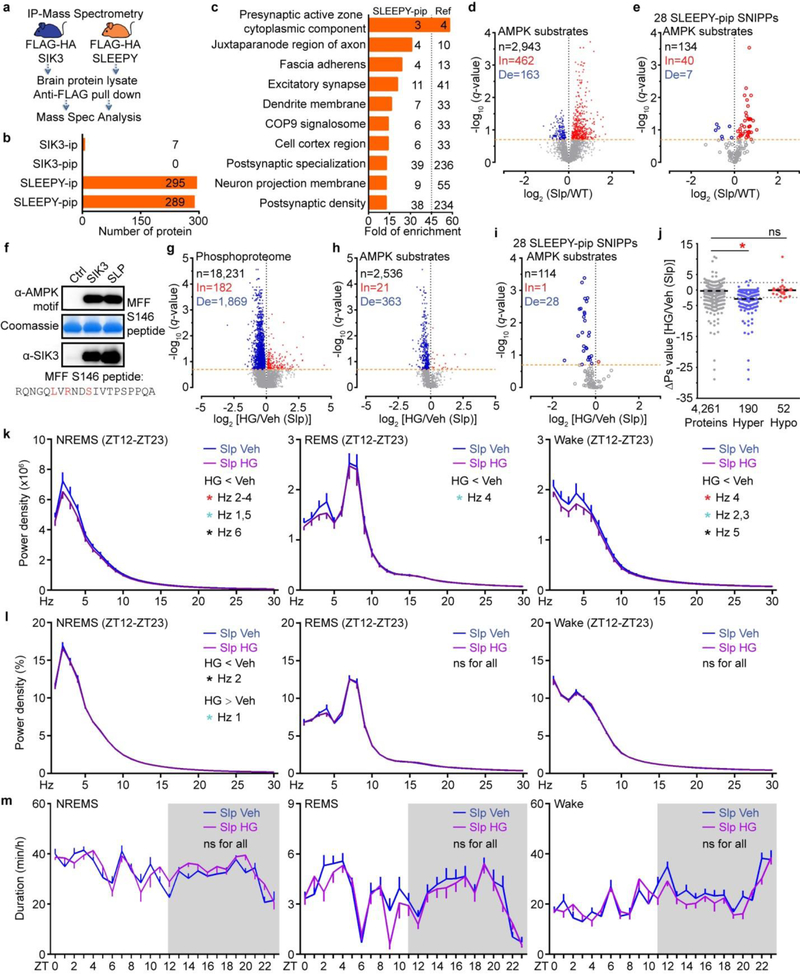
Extended Data Figure 9 |. SLEEPY causes constitutively high sleep need by preferentially associating with and phosphorylating SNIPPs.
a, Experimental design for comparing the interactomes of SIK3 and SLEEPY from whole brain lysates. b, Summary of SIK3 and SLEEPY interacting proteins (ip) and preferential interacting proteins (pip). c, Gene-annotation enrichment analysis of 289 SLEEPY preferential interacting proteins (SLEEPY-pip). GO cellular component enrichment analysis using all 22,262 genes of Mus musculus as reference (Ref). Fisher’s Exact with FDR multiple test correction was used to determine statistical significance. Top 10 GO terms of fold enrichment (FDR < 0.0001), the gene number of SLEEPY-pip and Ref in each term are shown. d-e, Volcano plots showing phosphorylation changes of all putative AMPK substrates in the Slp/WT group (d) or from the 28 SLEEPY-pip SNIPPs (e). Orange dotted lines (q = 0.2). f, In vitro kinase assay of recombinant SLEEPY and SIK3, and immunoblotting with AMPK phospho-motif antibody (two independent experiments). g–i, Volcano plot showing comparative analysis of whole brain phosphoproteomes (g), all putative AMPK substrates (h) or from 28 SLEEPY-pip SNIPPs (i) in the HG/Veh (Slp) group. Orange dotted lines (q = 0.2). j, Quantitative ∆Ps analysis of 190 Hyper-phosphoproteins and 52 Hypo-phosphoproteins in HG/Veh (Slp) group. Dotted lines (∆Ps = +/−2.4). k-m, Analysis of absolute EEG power spectra (k), relative EEG power spectra (l), duration (m) of NREMS, REMS and wake states of Sik3Slp/+ (Slp, n = 14) mice injected with vehicle (Veh) or 8mg/kg HG-9–91-01 (HG) at ZT6 and ZT9. Multiple unpaired t-test (p-value) following FDR (q-value) analysis (d-e, g-i). Mean, one-way ANOVA with Dunnett’s test (j). Mean ± s.e.m., two-way ANOVA with Sidak’s test (k-m). *(black) P < 0.05; *(cyan) P < 0.01; *(red) P < 0.001; ns, P > 0.05.

