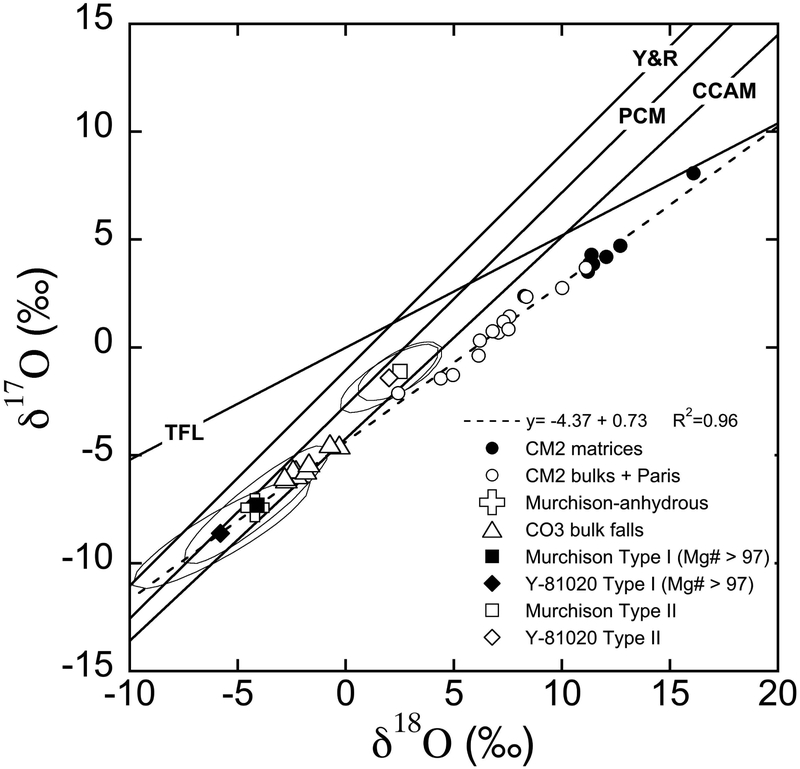
Fig. 10.
Oxygen three-isotope diagram of CM and CO bulk samples, type I and type II chondrules, CM matrix, and the anhydrous mineral separates in Murchison. The four reference lines (Y&R, PCM, CCAM, and TF lines), regression line (dashed line), and data for the CM2 and CO3 bulks, CM2 matrices, and the anhydrous mineral separates of Murchison are the same as in Fig. 1. For type I chondrule mean values, chondrules with Mg# >97 are used. For Murchison, type I chondrule average values are obtained excluding chondrule C6. For Y-81020, the average value of type I chondrules with Mg# >97 are calculated using data from Tenner et al. (2013). The 2SD uncertainties of the type I and type II chondrules are represented by ovals corresponding to the covariance matrix of δ18O and δ17O for each data set.

