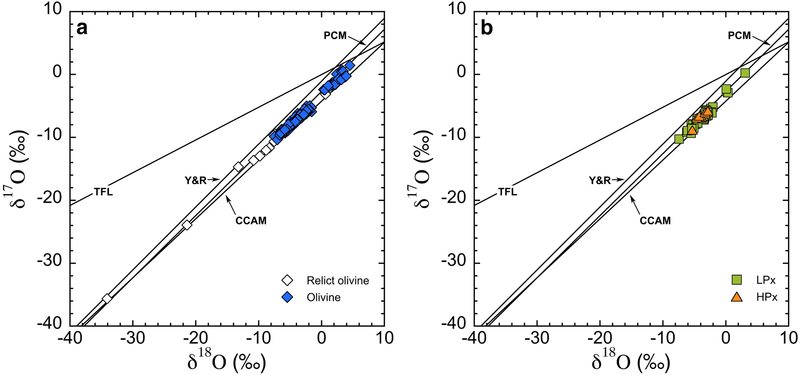
Fig. 4.
Oxygen three-isotope diagram of individual spot analyses of chondrules in Murchison. a) olivine. Relict olivine grains are shown as open symbols. b) pyroxene. Low-Ca pyroxene (LPx): squares, high-Ca pyroxene (HPx): triangles. Uncertainties of individual data, corresponding to the spot-to-spot reproducibility (2SD), are smaller than the size of symbols. The four reference lines are the same as in Fig. 1.

