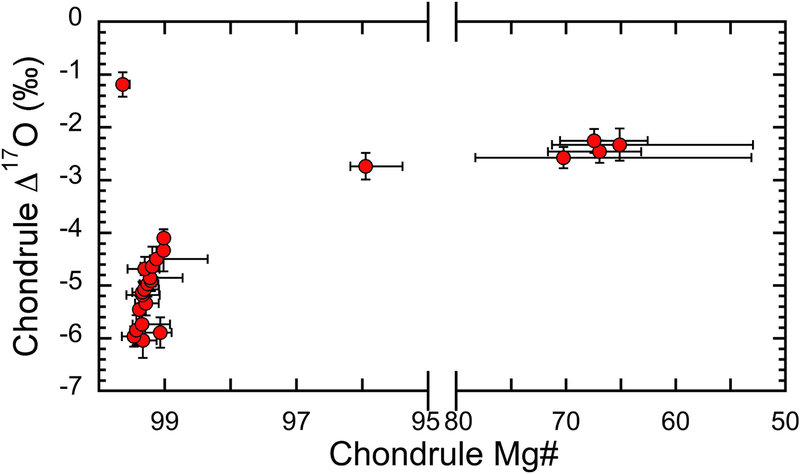
Fig. 6.
Murchison chondrule Δ17O values vs. Mg#’s. Each point represents the host Mg# and Δ17O values of individual chondrules. Chondrule Mg# uncertainties correspond to the range of measured values, while uncertainties in Δ17O are those of the mean value at 95% confidence level, shown in EA4.

