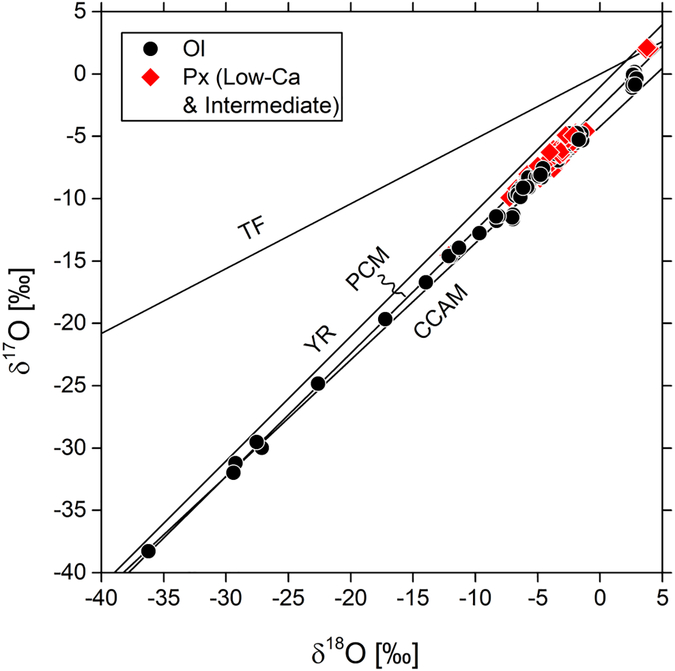
Figure 2:
Oxygen three-isotope diagram showing olivine (n=124) and pyroxene (n=95) analyses from chondrules in Kaba. Most analyses plot on the primitive chondrule mineral (PCM; Ushikubo et al., 2012) line or in between the PCM and CCAM (Clayton et al., 1977) lines; analyses of chondrule K25 plot above PCM and on terrestrial fractionation (TF) line. YR: Young & Russel line (Young and Russell, 1998).

