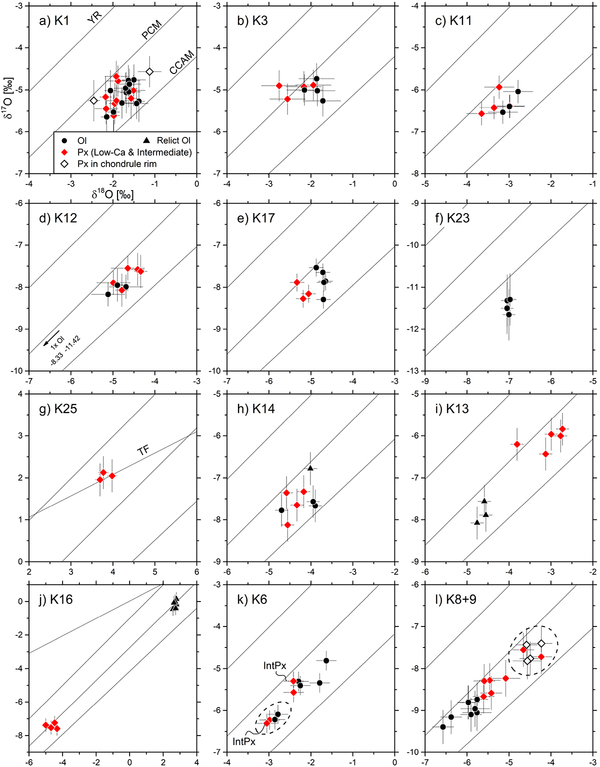
Figure 3:
Oxygen three-isotope diagrams of individual olivine and pyroxene analyses of representative chondrules in Kaba. Error bars show external reproducibility (2SD) obtained by analyses of the bracketing olivine standard. (a-g) Individual analyses are indistinguishable in terms of their Δ17O values within the variability threshold of ±0.6‰. (h) One olivine analysis in chondrule K14 slightly exceeds variability threshold. (i-j) Olivine and pyroxene analyses form distinct clusters, while (relict) olivine are either 16O-rich (K13) or 16O-poor (K16) relative to pyroxene. (k-l) analyses of K6 and K8+9 show clearly resolvable variability in δ18O and δ17O values (2SD: 1.0‰ – 1.4‰) but Δ17O values are within variability threshold (±0.6‰). Both chondrules are marginally heterogeneous. In K6 (k), analyses located in right hand part of chondrule are relatively more 16O-rich (circled data points). In K8+9 (l) pyroxene analyses in the rim and a few locations of the chondrule interior (circled data points) are 16O-poor relative to the rest of the analyses.

