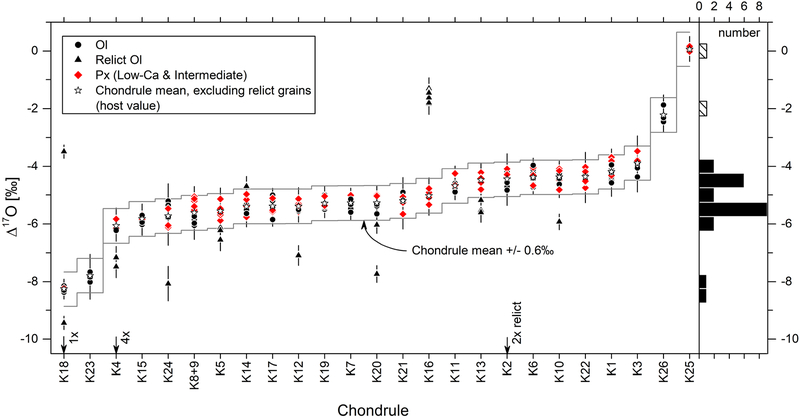
Figure 4:
Δ17O values of olivine and pyroxene analyses per individual chondrule. Error bars show external reproducibility (2SD) obtained by analyses of the bracketing standard. Chondrules sorted according to increasing host chondrule Δ17O values (stars) which are obtained by averaging Δ17O values of isotopically homogeneous olivine and/or pyroxene analyses after excluding isotopic relicts (triangles). Δ17O values of relict olivine exceed the variability threshold (grey line; ±0.6‰, mean external precision on bracketing standard, 3SD). Most type I chondrules show host chondrule Δ17O values in between −6‰ and −4‰ as illustrated by the histogram on the right-hand side of the graph.

