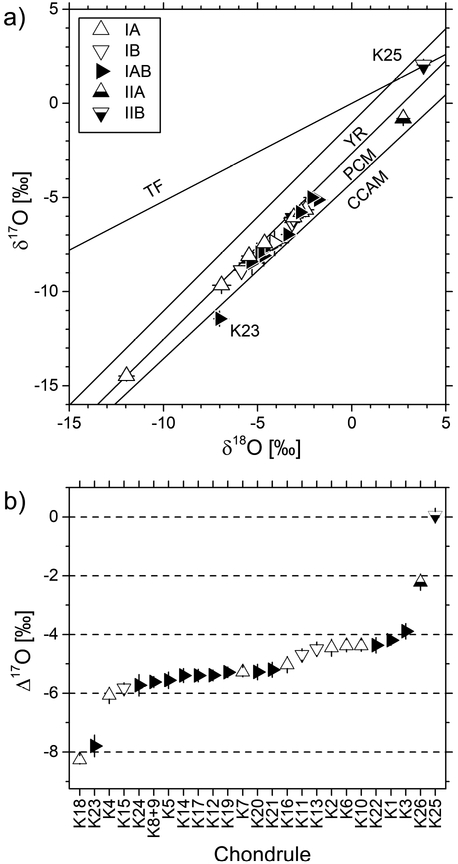
Figure 6:
Host chondrule isotope ratios (δ18O, δ17O, and Δ17O) and textures of chondrules. Error bars represent propagated uncertainty of the mean values. (a) Oxygen 3-isotope diagram showing chondrule means. Reference lines are the same as those in Fig. 2. Host values of chondrules plot on the PCM line or slightly below. Exceptions are chondrules K23 (IAB) and K25 (IIB). (b) Host Δ17O values are independent of chondrule texture among type I chondrules. Type II chondrules are 16O-poor compared to type I chondrules.

