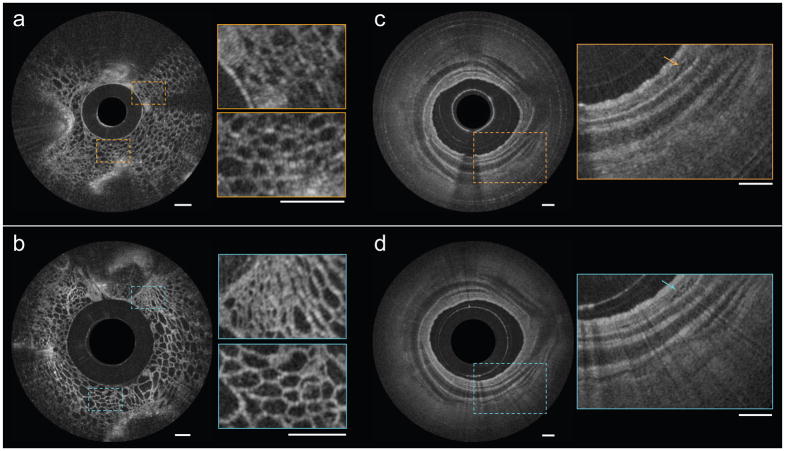
Figure 5. Comparison of OCT images obtained using the nano-optic endoscope and a conventional OCT catheter.
OCT images of fruit flesh (grape) obtained using a ball lens catheter (a) and the nano-optic endoscope (b). Ex vivo images of swine airway using a ball lens catheter (c) and the nano-optic endoscope (d). Arrows indicate fine glands in bronchial mucosa. All scale bars are 500 μm.

