Figure 4.

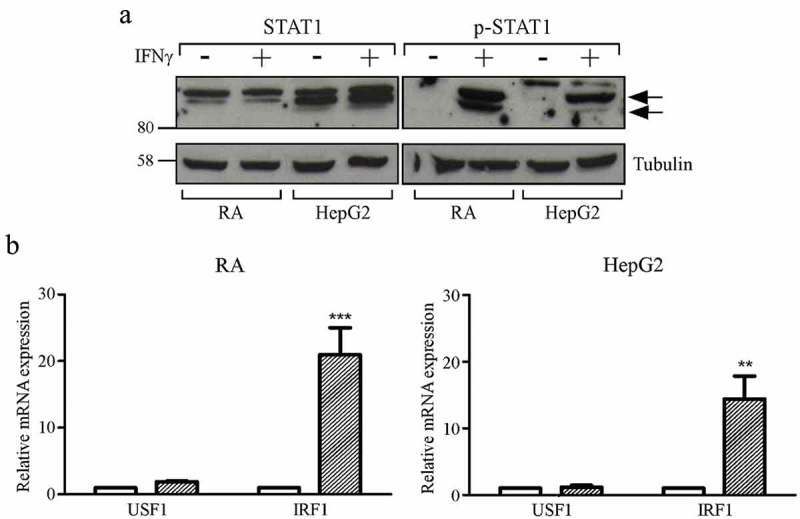
STAT1 phosphorylation and significant increase of IRF1 mRNA levels after treatment with IFNγ in HepG2 hepatocarcinoma and RA glioma cell lines.
(a) Total cell extracts of RA and HepG2 cell were collected after 72 hours treatment with IFNγ (+) or its vehicle (-) and analyzed by western blotting using anti-STAT1 and anti-phosphorylated-STAT1 (p-STAT1) antibodies. Tubulin was used as a loading control. The two black arrows on the right indicate the bands corresponding to the phosphorylated STAT1. A representative experiment is shown out of three independent experiments with very similar results. (b) USF1 and IRF1 mRNAs expression in RA (left panel) and HepG2 (right panel) cells treated with IFNγ (dashed colums) or with its vehicle (white colums) for 72 were assessed by qRT-PCR. The results of three representative experiments performed in triplicates are shown. USF1 and IRF1 mRNA levels in IFNγ treated cells are expressed as values relative to those of untreated cells set to 1. Two-WAY ANOVA test has been performed (** p ≤ 0.01 for Hep-G2 and *** p ≤ 0.001 for RA as compared to corresponding untreated cells). Error bars represent the standard deviation.
