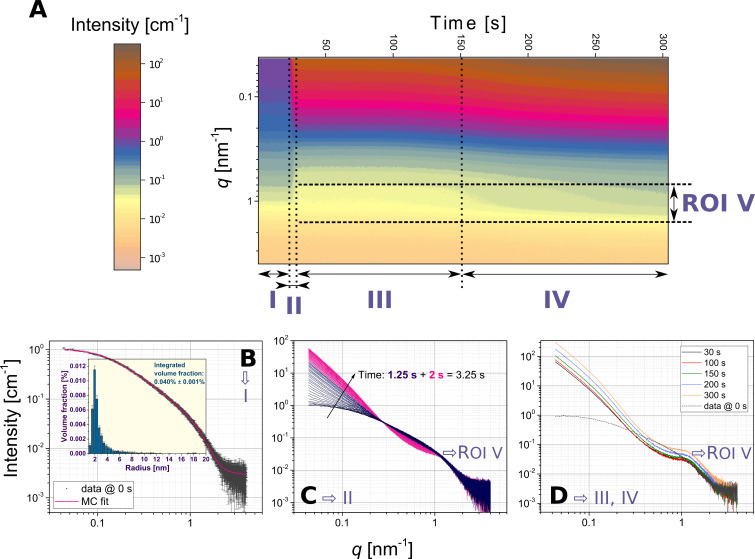
Figure 1.
Time-resolved and in situ SAXS patterns documenting the formation of silica–lysozyme aggregates from an experiment where data was recorded at a rate of 50 ms/pattern (20 fps); A) contour plot depicting the scattering intensity as a function of q and time. The changes in the data reveal four distinct time periods; I – scattering from pure silica NPs, II – the moment of lysozyme injection, III – the growth of the aggregates/composites with the original form factor of the silica NPs preserved, and IV – further growth of aggregates and a change in the original silica NPs. We further identified a q-range as a region of interest “ROI V” indicating a local maximum due to interparticle correlations; B) the initial silica NP form factor with a Monte Carlo (MC) fit and the derived discrete particle size distribution (inset); C) the scattering data for period II showing the time frames spanning the injection of the LZM solution between 24.25 s and 27.50 s of the experiment, with the first 1.25 s (blue) dominated by the formation of large aggregates, followed by ca. 2 s (pink) during which the local maximum related to the interparticle interactions (ROI V) clearly developed; D) selected patterns spanning periods III and IV highlighting the differences in the form factor of the silica particles (q > 1.5 nm−1). In C) and D) the data uncertainties are not shown for clarity.

