Figure 1.
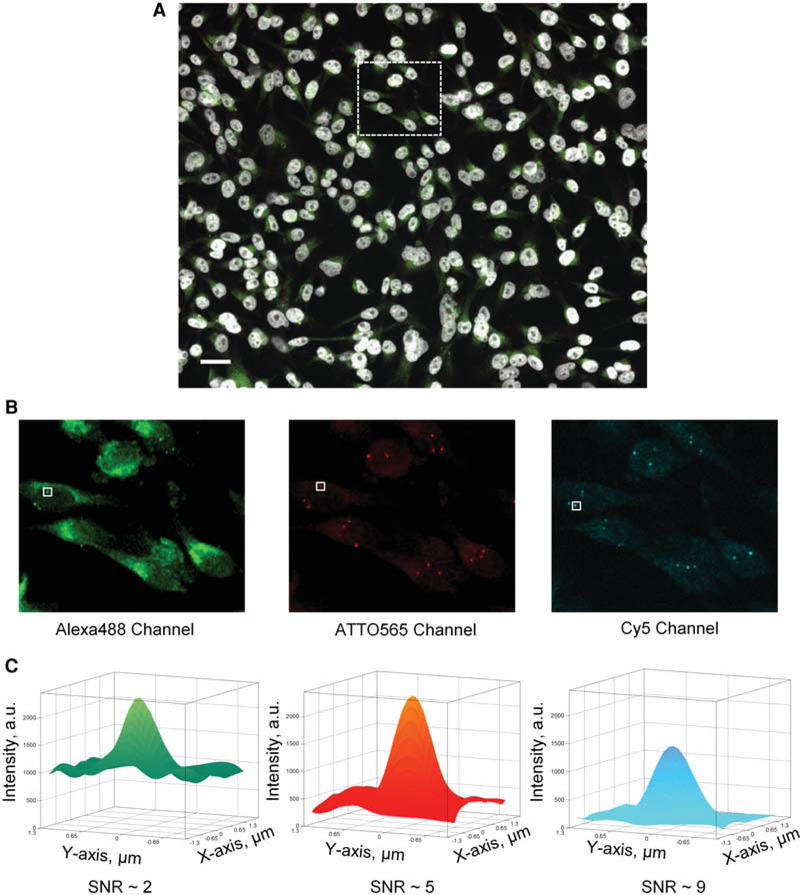
(A) Representative maximum intensity projection images of MDA-MB-231 cells from one of the 48 wells with a unique Oligopaint DNA FISH set from test plate Test-P2. The DAPI-stained nuclei (blue channel) are displayed in grayscale, whereas the Alexa488 (green channel), ATTO565 (red channel), and Cy5 (far-red channel) channels are displayed using green, red, and cyan lookup tables, respectively. Scale bar, 10 μm. (B) Three Oligopaint DNA FISH channels corresponding to the region enclosed by the dashed box in A. (C) Representative surface rendering of the DNA FISH signals intensity identified by the solid-white colored boxes in B. The surface plots were generated by interpolating the raw DNA FISH signal intensities (Z-axis, arbitrary units) of 8 × 8 pixels region centered around the brightest pixel of the DNA FISH spot (1 pixel = 0.325 μm). The DNA FISH signal intensity for the Alexa488-labeled genomic locus had higher background around 1000 arbitrary units (a.u.) with peak signal of ~2000 a.u., thus leading to a signal-to(background/)noise ratio (SNR) of ~2. The ATTO565- and Cy5-labeled DNA had lower background, 400 and 160 a.u., respectively, and SNR of 5 and 9, respectively.

