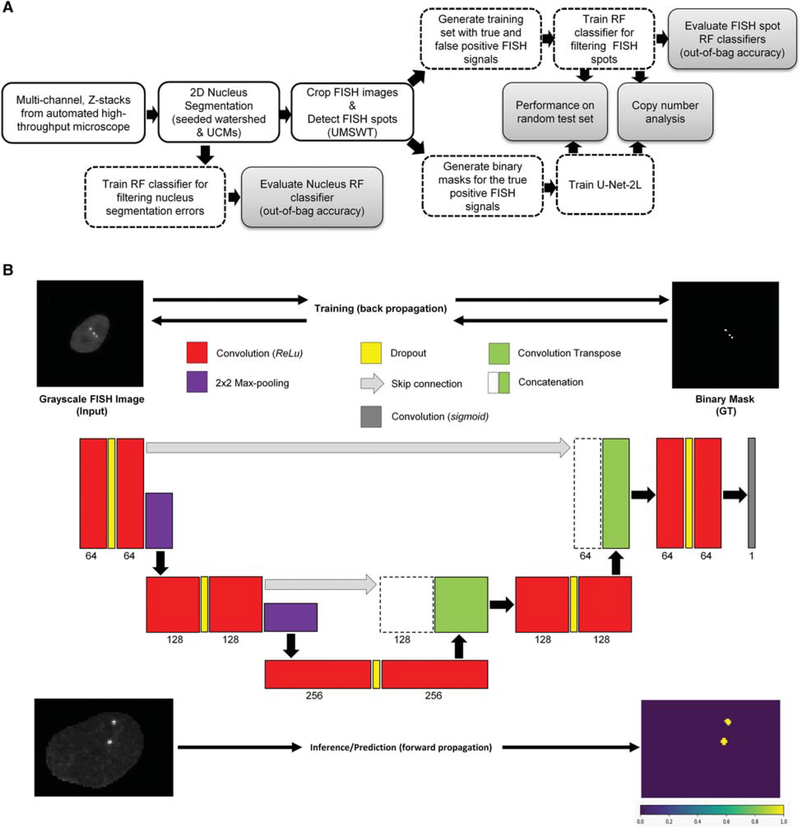
Figure 2.
(A) Schematic of the image analysis workflow for detecting DNA FISH signals from high-throughput microscope images (blue-shaded block). The top branch after the spot detection block corresponds to a first approach for detecting and filtering DNA FISH signal using a random forest (RF) classifier, whereas the bottom branch corresponds to a second approach using fully CNN (U-Net-2L). UCMs, ultrametric contour maps; RF, random forest(s); UMSWT, undecimated multiscale wavelet transform. (B) The U-Net-2L architecture used for DNA FISH signal segmentation. During the training phase, the CNN model uses a grayscale DNA FISH image (top left) along with binary mask (GT; top right) corresponding to DNA FISH signals for optimizing the model parameters using error back-propagation. The numbers below each layer in the CNN correspond to the number of convolution filters and the height of each layer is proportional to the height of the input image(s). During the prediction (inference) phase, for a given grayscale DNA FISH image (bottom left) the CNN model predicts the probability of each pixel belonging to a DNA FISH signal (bottom right). Red boxes represent the 2D convolutional layer with 3 × 3 filter size and ReLU activation; purple boxes represent the maximum-pooling layers using 2 × 2 window size; green boxes represent the up-convolutional (convolutional transpose) layer; yellow boxes correspond to dropout layers; the gray box corresponds to a 1 × 1 convolution layer with sigmoid activation function for generating probability for each pixel belonging to a DNA FISH signal; green boxes along with dashed boxes represent concatenation layer to merge information from different resolutions/ scales.

