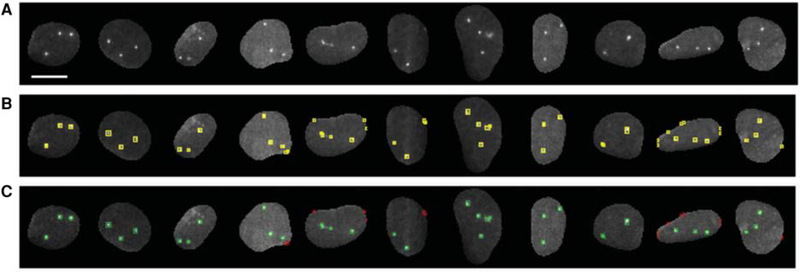
Figure 4.
(A) Representative examples of DNA FISH images used for generating the training set(s) for (a) spot filtering using random forest classifier(s) and (b) binary masks for CNN spot segmentation. Scale bar, 10 μm. (B) Spots detected by the wavelet-based method with low stringency detection parameters. Each detected object in the nucleus is labeled with a yellow color bounding box. (C) Detected objects after user annotation using an interactive KNIME workflow. Spots labeled class-goodFISH and class-badFISH by the user are shown in green and red colors, respectively. Nuclei in which all the DNA FISH signals were labeled as class-goodFISH were used for generating the binary masks for CNN.

