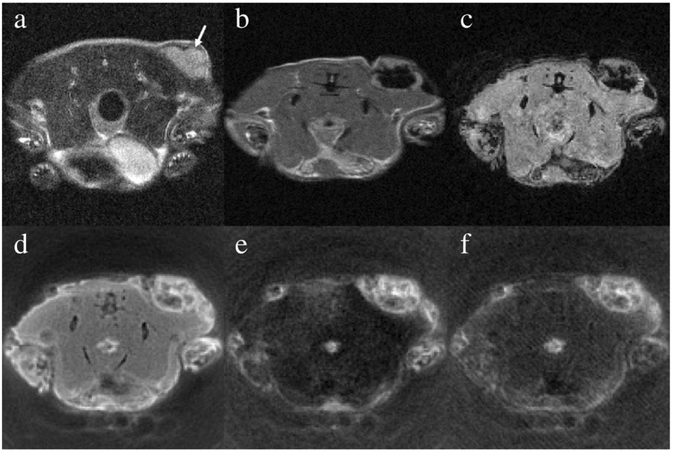
Fig. 3.
This figure presents the in vivo MR images before and after intra-tumor injection of the aqueous IONP suspension. (a) The pre-injection image was acquired using the fast spin echo sequence with TE = 30 ms. The tumor is indicated by the arrow. Immediately after the injection, the mouse was scanned using (b) the fast spin echo sequence with TE = 12 ms, (c) the spoiled gradient echo sequence with TE = 3.15 ms, (d) the SWIFT sequence with TE = 3.9 –s, (e) the SWIFT-2sat sequence with two 8 ms Gaussian pulses, and (f) the SWIFT-1sat sequence with one 2 ms Gaussian pulse.

