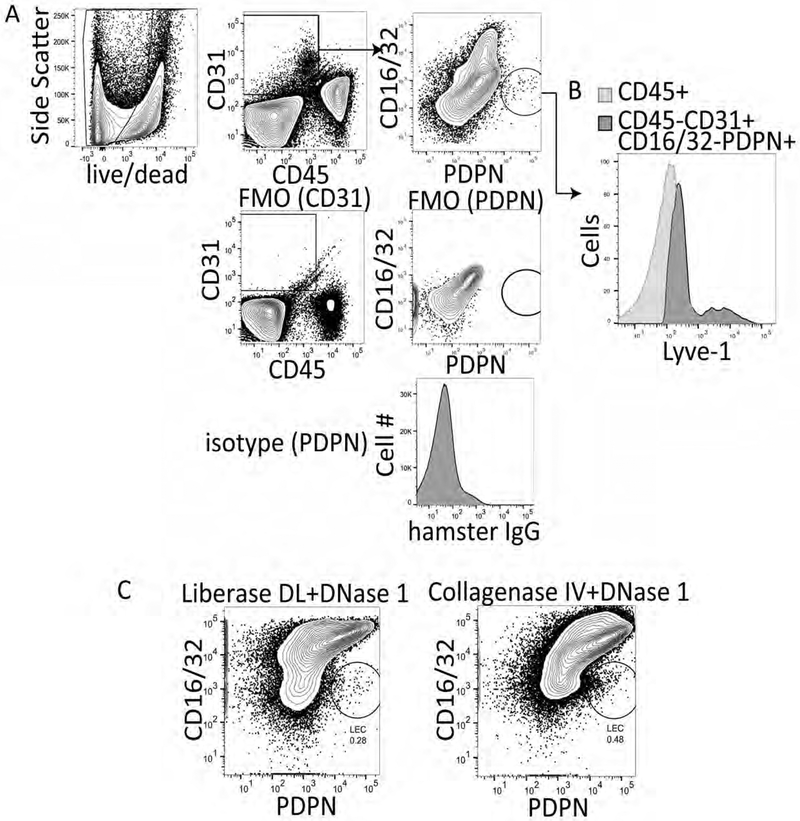
Figure 1. Representative flow cytometry analysis of liberase DL and collagenase IV digested murine liver tissue.
A. Gating strategy, fluorescence minus one staining and isotype controls for the procedure. Data were analyzed with FlowJo analysis software after acquisition on a BD FacsCanto II. B. Lyve-1 staining of CD16/32- PDPN+ cells. C. Final flow cytometry gate after digesting mouse livers with either liberase DL or Collagenase IV and evaluating CD16/32 PerCP X PDPN PE-Cy7 where LECs are CD16/32- and PDPN+.

