
Figure 2. Effects of dietary EGCG on hepatic lipid contents and severity of fatty liver.
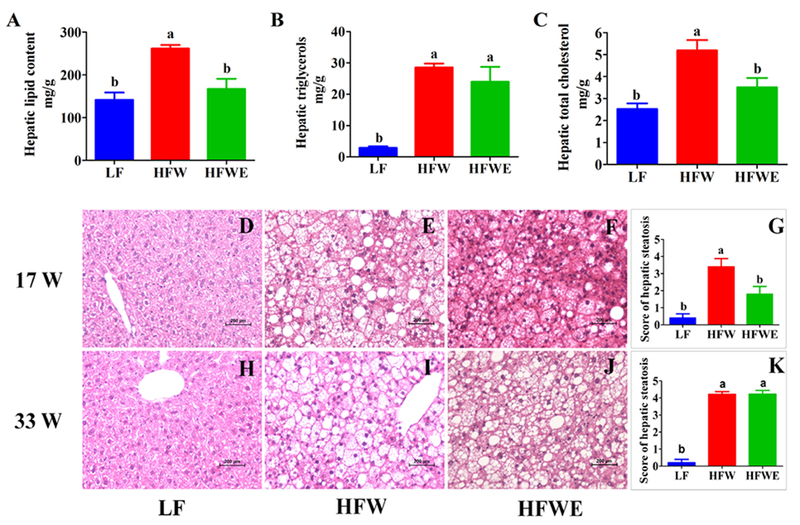
A, hepatic total lipid contents; B, hepatic total cholesterol contents; C, hepatic total triacylglycerol contents; and D, E, F and G are liver slices and hepatic steatosis score of mice at week 17; H, I, J and K are hepatic histological data from mice at week 33. D, H mice in LF groups; E, I, mice in HFW groups; F, J, mice in HFWE groups. All data are expressed as mean ±SEM (for LF group, n=5; for HFW and HFWE groups, n=10) a,b,cSignificant difference (ANOVA, p < 0.05).