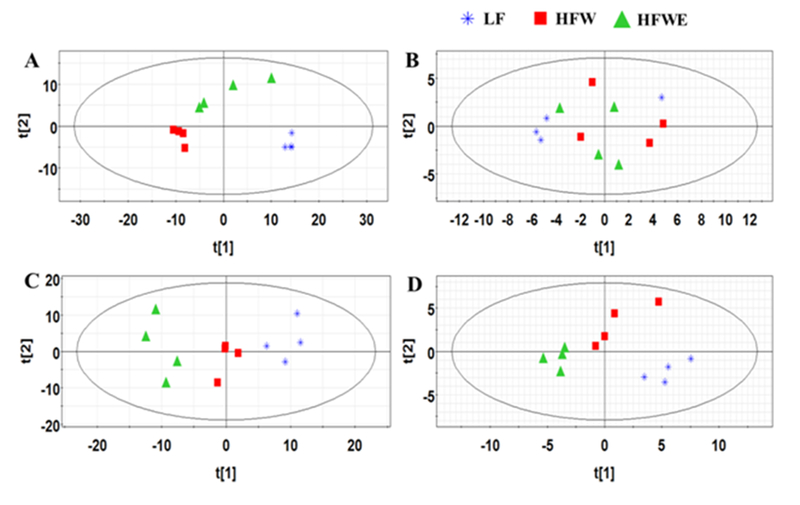
Figure 3. Principal component analysis (PCA) score plots of liver and serum samples at week 17 using the lipidomics analyzing database.

A, Hepatic positive ionization analysis; B, Hepatic negative ionization analysis; C, Serum positive ionization analysis; D, Serum negative ionization analysis; each point represents an individual liver or serum sample from LF, HFW and HFWE groups. The t[1] and t[2] correspond to principal components 1 and 2, respectively.
