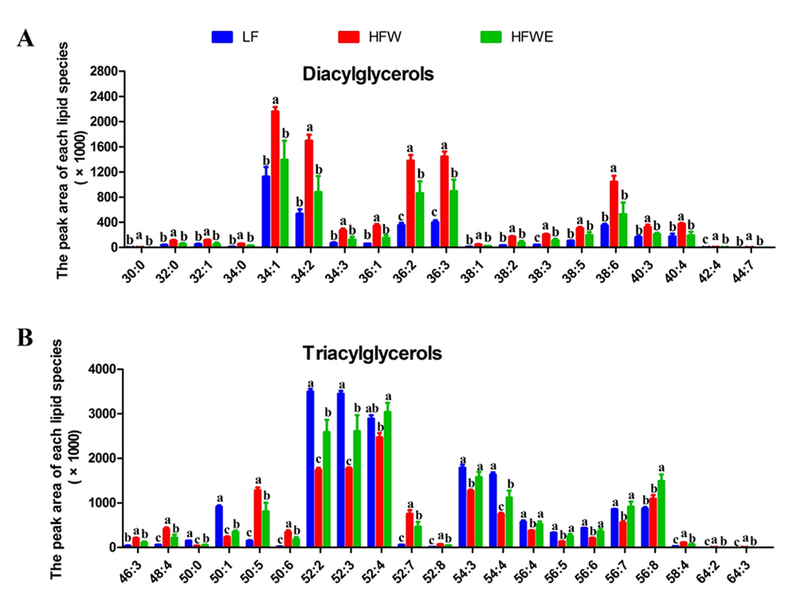
Figure 4. Hepatic lipid profiles analyzed by lipidomics.

The designations of each panel are indicated in the figure. Data are presented as mean ± SEM, (for LF group, n=4; for HFW and HFWE groups, n=5). a,b,cSignificant difference among groups (ANOVA, p < 0.05).
