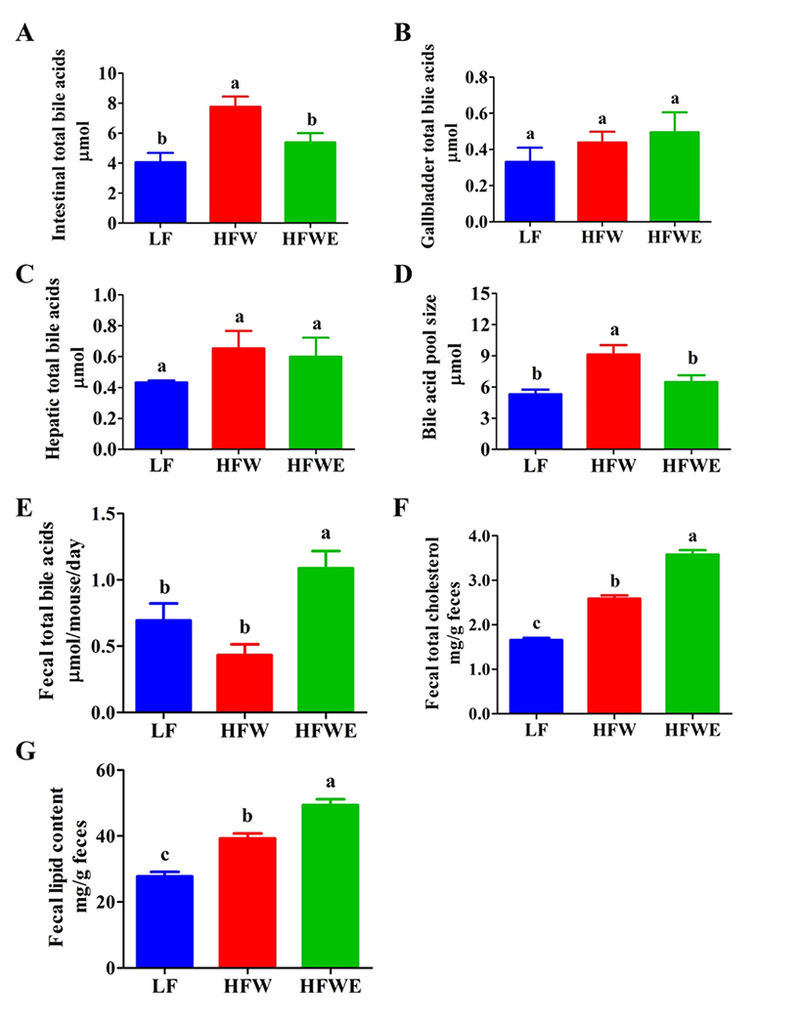
Figure 6. Effects of dietary treatments on total bile acids, fecal bile acids and fecal lipids.

On week 17, the total bile acid contents were measured in the small intestine (A), gallbladder (B), and liver (C). The bile acid pool size (D) is the sum of total bile acid contents in these samples. Also shown are the fecal bile acid contents (E) on week 17 and the fecal levels of total fat (F) and cholesterol (G) on week 20. All data are expressed as mean ± SEM (for LF group, n=5; for HFW and HFWE groups, n=10). a,b,cSignificant difference, (ANOVA, p < 0.05).
