
Figure 7. Effects of treatment on mRNA expression levels of genes in the liver and ileum.
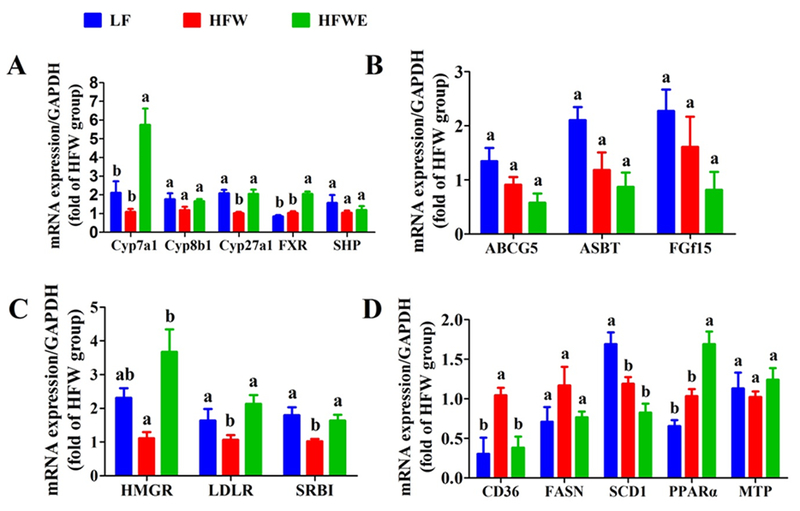
Mice were sacrificed on week 17. mRNA expression of key genes related to bile acid metabolism were measured in the liver (A) and ileum (B). mRNA expression of key genes related to cholesterol and fatty acid metabolism in the liver were also shown (C, D). All data are expressed as mean ± SEM (for LF group, n=5; for HFW and HFWE groups, n=10). a,b,cSignficant difference among groups (ANOVA, p < 0.05).