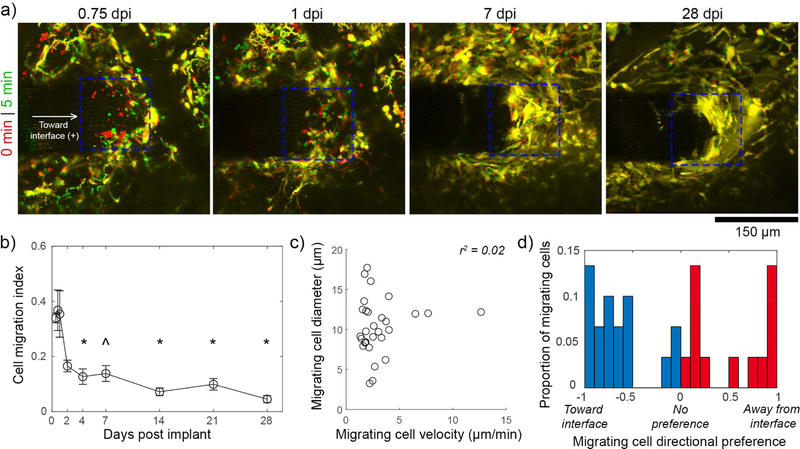
Figure 2.
Meningeal CX3CR1(+) cells migrate along the electrode’s surface during the first days post-implant. (a) Superimposed images of the meningeal-electrode interface (ROI denoted by blue dashed box) at earlier (red) and later (green) time points show CX3CR1(+) cell movement as green and red, while stable elements are yellow. Images are tracking the same animal over time. (b) A cell migration index (fraction of cells at the meningeal-electrode interface that are moving) shows that there is significantly greater migration at 0.5–0.75 dpi compared to 4–28dpi (one-way ANOVA, p < 0.00001; * denotes significant differences from both 0.5–1dpigroups with Tukey’s HSD post-hoc tests, ^ denotes significance relative to 0.75–1 dpi only ; p < 0.05).Data presented as mean ± SEM, where n = 4 from 0.5–1dpi and 14–21dpi, n = 5 from 2–7dpi, and n =3 at 28dpi). (c) Migrating cells at 0.5–1dpi have a velocity of 3.04 ± 2.31 µm/min and a diameter of 10.31 ± 3.46 µm with no apparent relationship between these parameters (mean ± st. dev.) with a linear regression R-squared value of 0.02. Individual cells displayed in graph (n = 30). (d) Migrating cells show no clear preference (For each cell: net movement / total distance traveled) for migrating toward (blue bars) or away from (red bars) the interface.

