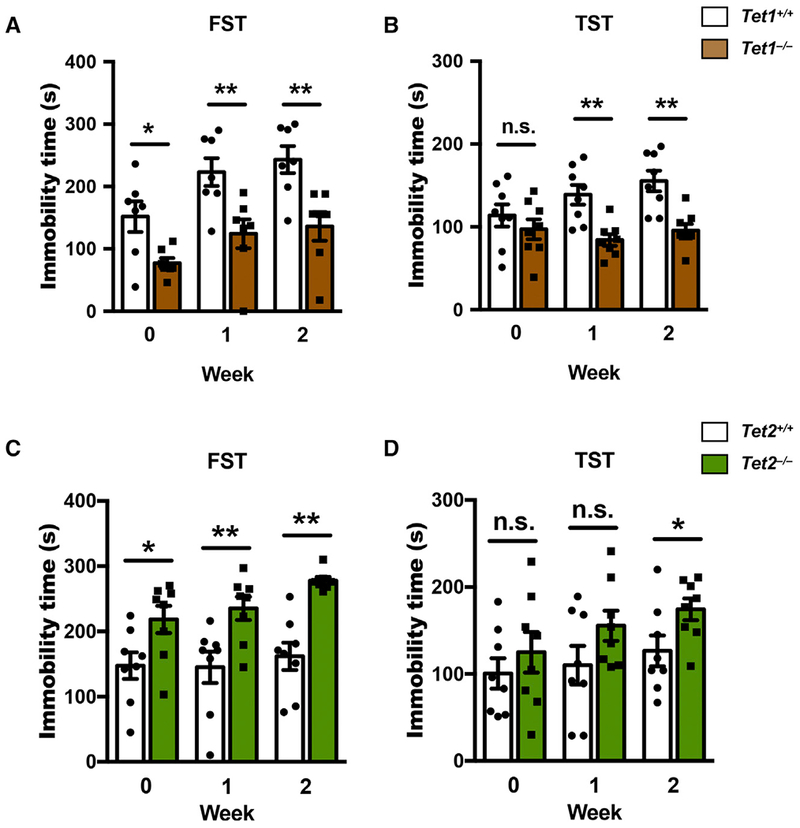
Figure 2. Tet1 KO and Tet2 KO Mice Exhibit Distinct Responses to CRS.

(A–D) FST and TST occurred with Tet1 KO (Tet1−/−, on C57BL/6 background) or Tet2 KO (Tet2−/−, on 129 background) mice and their littermate control (Tet1+/+ or Tet2+/+) mice at a different time point (0, 1, and 2 weeks) after CRS. Compared with respective littermate control mice, Tet1−/− mice showed significant less immobility time in both FST (A) and TST (B), whereas Tet2−/− mice showed significant more immobility time in both FST (C) and TST (D). n = 7–8, error bars indicate mean ± SEM; two-tailed unpaired t test; *p < 0.05; **p < 0.01. See also Figure S2.
