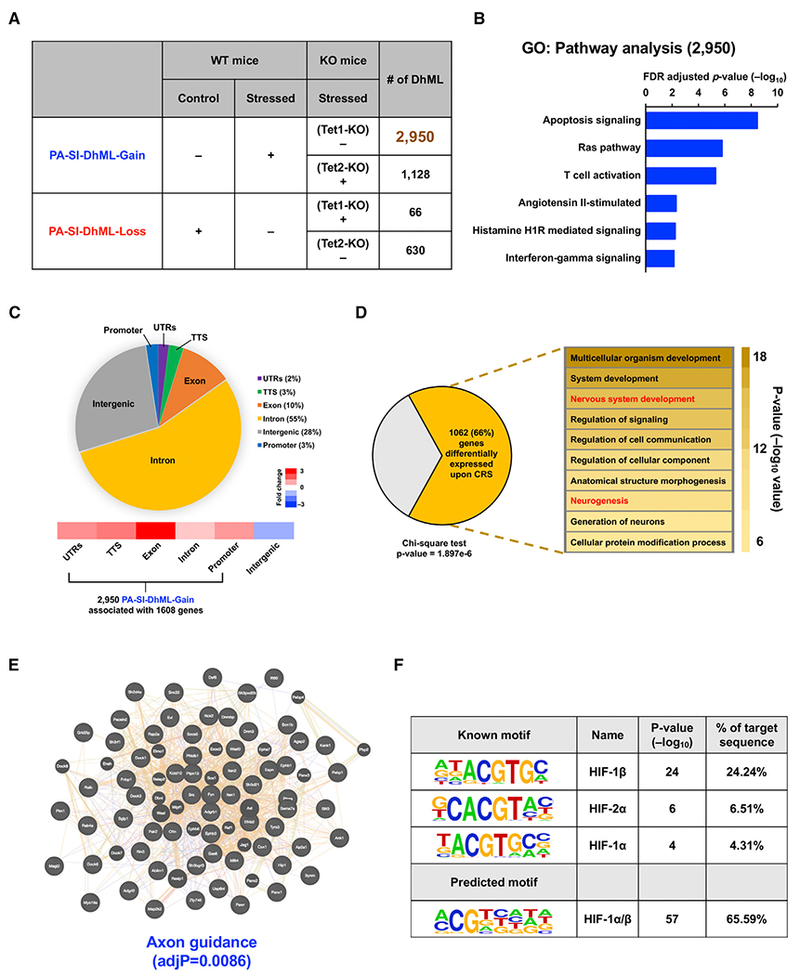
Figure 3. Identification and Characterization of Phenotype-Associated SI-DhMLs in PFC.

(A) Identification of gain-of-5hmC and loss-of-5hmC loci of phenotype-associated SI-DhMLs (PA-SI-DhMLs), i.e., PA-SI-DhML-Gain and PA-SI-DhML-Loss.
(B) GO analysis on pathways with 2,950 PA-SI-DhML-Gain suggested that these gain-of-5hmC loci were significantly involved in the Ras and T cell activation pathways associated with depression.
(C) Genomic annotation of2,950 PA-SI-DhML-Gain to demonstrate their percentage of each genomic region and enrichment versus expected values. More than 70% of PA-SI-DhML-Gain occurred in the gene body region, which was highly enriched over the expected value.
(D) Significant number of PA-SI-DhML-Gain-associated genes (1,062 of 1,608) were differentially expressed under CRS (p value= 1.897e—6, chi-square test). GO analysis on these 1,062 genes indicated significant enrichment in neurological development-related functions (in red).
(E) Protein coding genes that associated with 2,950 PA-SI-DhML-Gain were selected and then subjected to protein-protein interaction (PPI) analyses using WebGestalt online software. PPI analyses revealed that the proteins associated with PA-SI-DhML-Gain were significantly involved in axon guidance (adjusted p value [adjP] = 0.0086).
(F) Motif search on 2,950 PA-SI-DhML-Gain revealed significant enrichment of the hypoxia-induced factor (HIF) binding motif. The motif alignment score is 0.71.
See also Figure S3.
