
Figure 4. TET1 Physically Interacts with HIF1α upon CRS and Leads to Dynamic 5hmC Alterations.
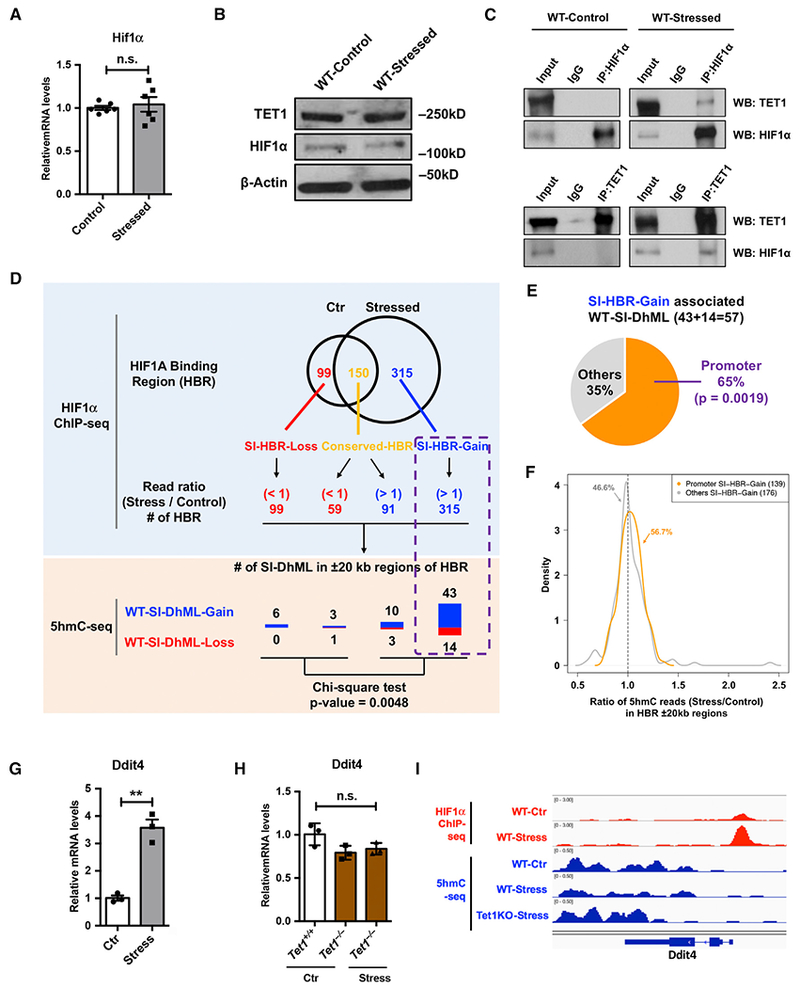
(A and B) qRT-PCR (A) and western blot (B) analysis showed little impact of CRS on TET1 and HIF1α protein in WT mouse PFC. β-actin is used as a loading control.
(C) By using an antibody against HIF1α or TET1, immunoprecipitation followed by western blot analyses revealed that only under the CRS condition could TET1 physically interact with HIF1α.
(D) The HIF1α binding regions (HBRs) with increased ChIP-seq reads (stress and control) were highly associated with WT-SI-DhMLs and PA-SI-DhMLs. Stress-induced differential HBRs were identified by overlapping HIF1α ChIP-seq peaks in WT-control and WT-stress samples, including 99SI-HBR-Loss, 150 conserved HBRs, and 315SI-HBR-Gain. ChIP-seq reads (stress and control) was further examined in conserved HBRs, revealing 59 HBRs with decreased ChIP-seq reads (read ratio < 1) and 91 HBRs with increased ChIP-seq reads (read ratio > 1). WT- and PA-SI-DhMLs in ±20-kb regions of each HBR were investigated, and we found that the HBRs with increased ChIP-seq reads were highly associated with WT-SI-DhMLs (p value = 0.0048, chi-square test).
(E) SI-HBR-Gain in promoter regions associated with significantly more WT-SI-DhMLs. In SI-HBR-Gain-associated WT-SI-DhMLs, 37 of 57 (65%) WT-SI-DhMLs were found to be significantly associated with those promoter-associated SI-HBR-Gain (p value = 0.0019, binomial test).
(F) Ratio density distribution of 5hmC normalized read counts (stress versus control, ±20-kb regions) in two SI-HBR-Gain lists: promoter and non-promoter (other)-associated SI-HBR-Gain. 56.7% of promoter SI-HBR-Gain show enriched 5hmC in stressed WT PFC compared to control, followed by 46.6% of non-promoter SI-HBR-Gain.
(G and H) CRS increased Ddit4 expression in WT mice, but not in Tet1 KO mice.
(G) qRT-PCR analysis of Ddit4 in WT PFC revealed a significant increase of Ddit4 mRNA level upon CRS. n = 3, error bars indicate mean ± SEM; two-tailed unpaired t test; **p < 0.01.
(H) qRT-PCR determined Ddit4 expression in the PFC of control Tet1+/+ and Tet1−/− mice and stressed Tet1−/− mice. Ddit4 exhibited little change upon the loss of Tet1, regardless of the stress condition. n.s., not significant. n = 3, error bars indicate mean ± SEM; two-tailed unpaired t test.
(I) 5hmC dynamic changes in gene body ± a 1.5-kb region of Ddit4 were visualized by an integrated genomics viewer (IGV). HIF1α ChIP-seq data are in red, and 5hmC-seq data are in blue.
See also Figure S4.