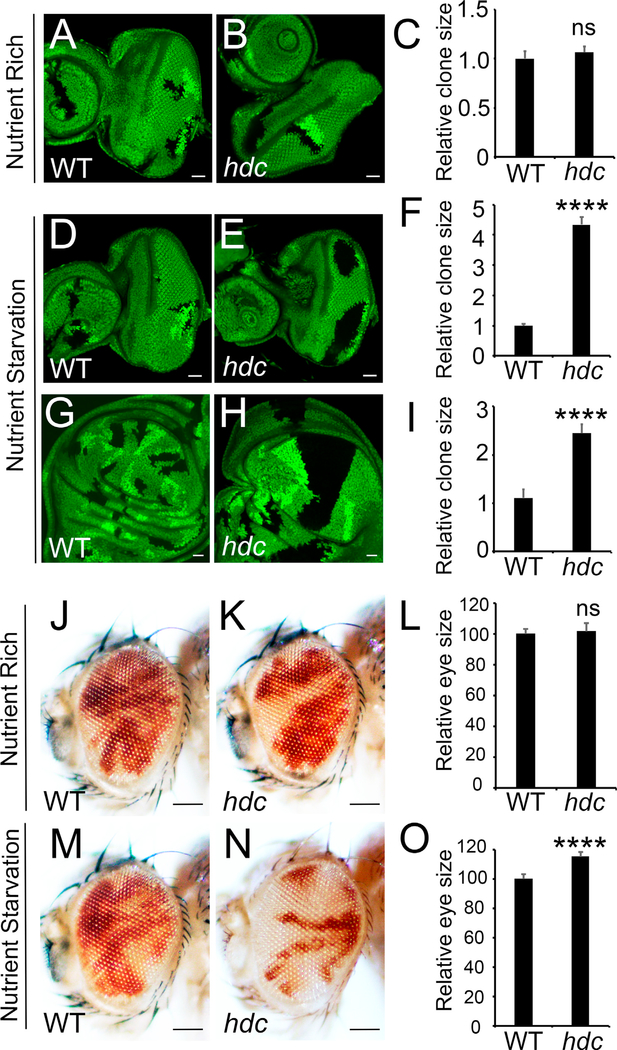
Figure 2. Hdc Regulates Tissue Growth in Response to Nutrient Restriction.
(A–I) Third instar eye discs containing control or hdc mutant clones (marked by the absence of GFP) from larvae reared under nutrient-rich (20 g/l yeast) conditions (A and B) or nutrient-starvation (5 g/l yeast) conditions (D and E). Third instar wing discs containing control (G) or hdc mutant (H) clones (marked by the absence of GFP) from larvae reared under nutrient-starvation (5 g/l yeast) conditions. Quantification of corresponding relative clone size compared with wild-type neighboring twin spots (C, F, and I). For each analysis (A, B, D, E, G, and H), a total of 9 clones (n = 9) were measured. The scale bars represent 20 μm.
(J–L) Adult eyes containing control clones (J) or hdc mutant clones (K, marked by the absence of red color) raised under normal conditions. Quantification of relative eye sizes (L). For each analysis (J and K), a total of 10 fly eyes (n = 10) were used. The scale bars represent 0.1 mm.
(M–O) Adult eyes containing control clones (M) or hdc mutant clones (N, marked by the absence of red color) raised under nutrient starvation conditions. Quantification of relative eye sizes (O). For each analysis (M and N), a total of 10 fly eyes (n = 10) were used. The scale bars represent 0.1 mm.
Data in (C), (F), (I), (L), and (O) are represented as means ± SD; ****p < 0.0001.

