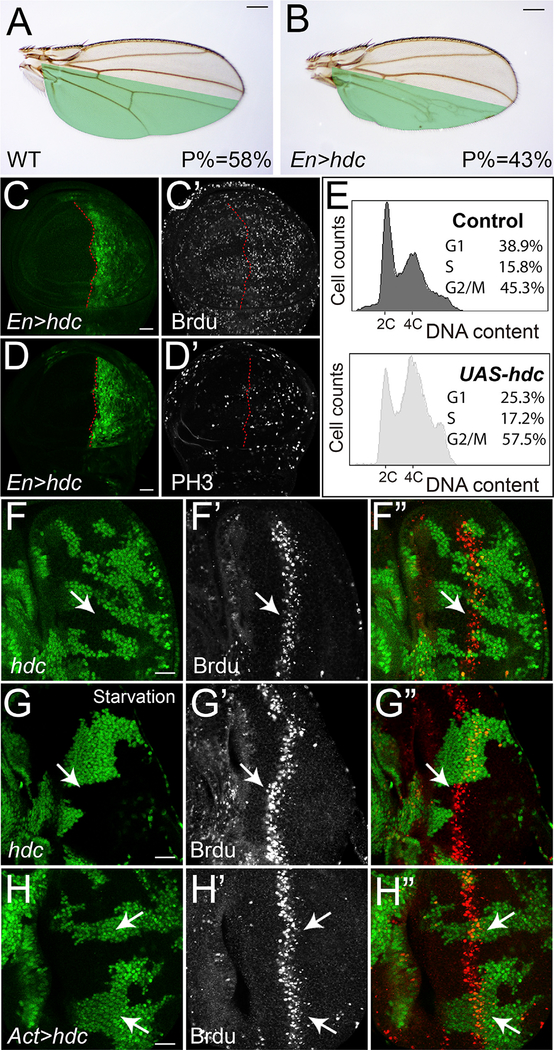
Figure 3. Hdc Regulates Cell Cycle Progression.
(A and B) A control wing (A) and a wing with Hdc overexpression (B) in the posterior compartment (marked in green) driven by Engrailed-Gal4 (En-Gal4). The average ratio of the size of posterior compartment to the whole wing (P%) was measured using ImageJ (n = 10). The scale bars represent 0.2 mm.
(C–D’) Third instar wing discs containing hdc-overexpressing clones (GFP-positive) were stained for Brdu (C’) and PH3 (D’). The scale bars represent 20 μm.
(E) Flow cytometric analysis of dissociated wing imaginal discs containing Hdc overexpression cells. Histograms showing DNA content of control cells (top) and hdc-overexpressing cells (bottom). The percentage of cells in each cell cycle phase were analyzed.
(F–G’’) A third instar eye disc containing hdc mutant clones (GFP-negative) raised under nutrient-rich conditions (F–G’’) or nutrient-starvation conditions (G–G’’) was stained for Brdu. The scale bar represents 20 μm.
(H–H’’) A third instar eye disc containing hdc-overexpressing clones (GFP-positive) was stained for Brdu (H’). The scale bar represents 20 μm.

