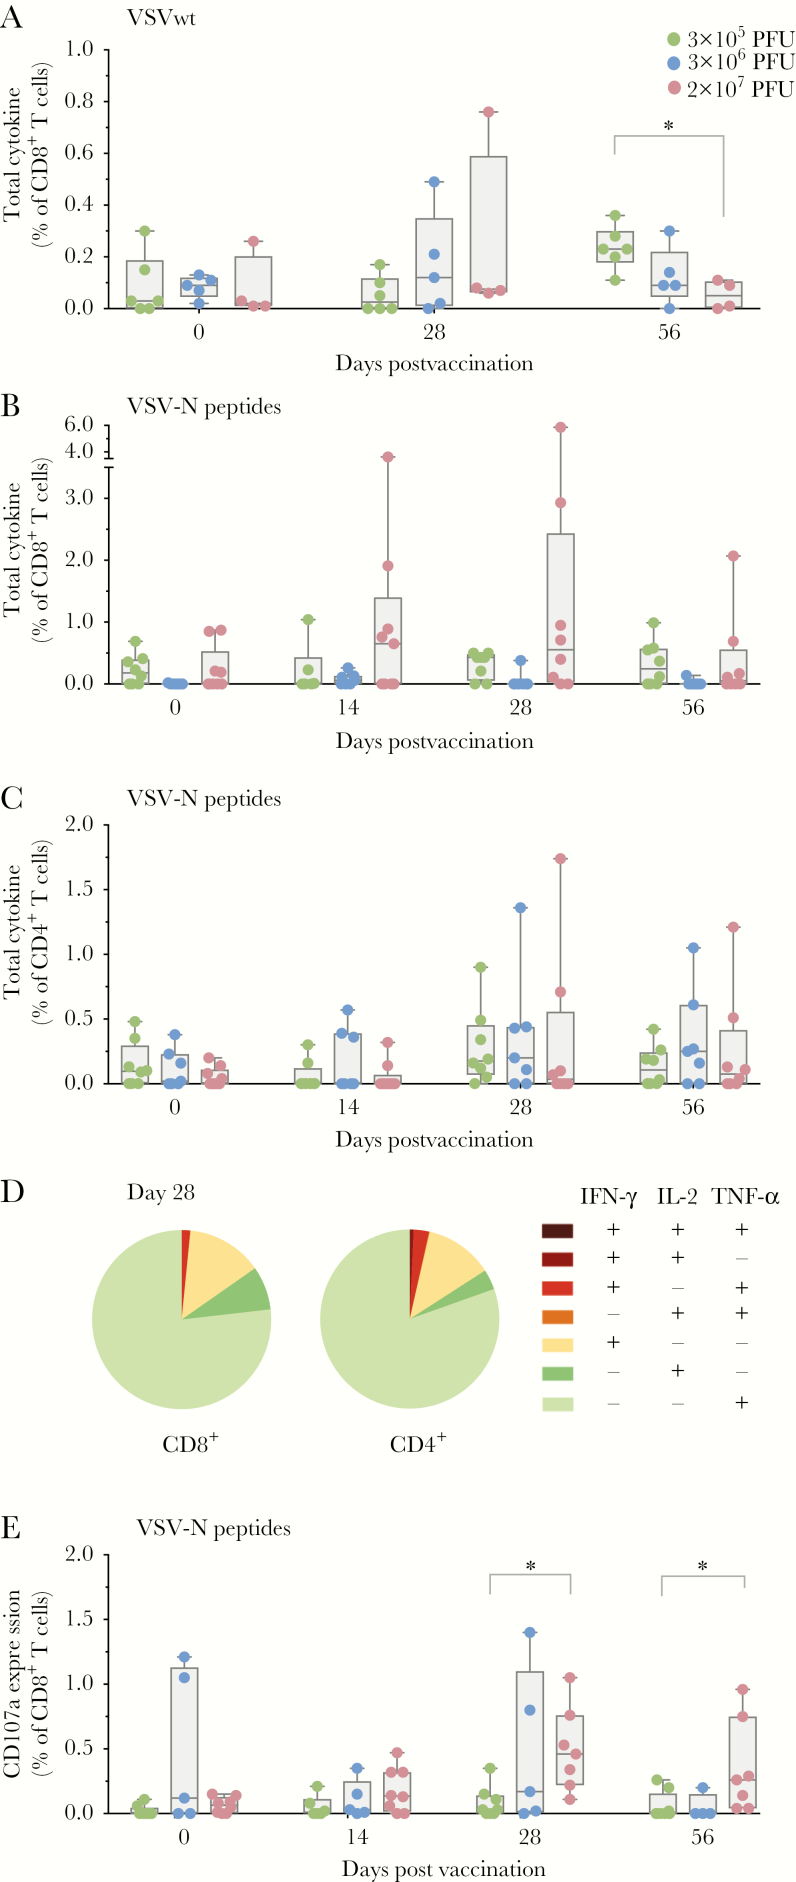
Figure 2.
Antigen-specific T cells against vesicular stomatitis virus (VSV). A, VSV wild-type (VSVwt)–specific T-cell responses. Peripheral blood mononuclear cells were stimulated with ultraviolet-inactivated VSVwt. Graph depicts the observed interferon gamma (IFN-γ)/interleukin 2 (IL-2)/tumor necrosis factor alpha (TNF-α) secretion of CD8+ T cells measured by flow cytometry. Each dot represents summarized cytokine responses of CD8+ T cells for 1 subject (3 × 10⁵ plaque-forming units [PFU]: n = 6; 3 × 10⁶ PFU: n = 5; 2 × 10⁷ PFU: n = 4). A significant intergroup difference between the low- and high-dose group was observed on day 56 (Mann–Whitney test, P = .01). B and C, Cytokine responses of CD8+ and CD4+ T cells (IFN-γ/IL-2/TNF-α) following stimulation with VSV nucleoprotein (VSV-N) overlapping peptide pools, respectively. Cytokine secretion was measured by flow cytometry (3 × 10⁵ PFU: n = 8; 3 × 10⁶ PFU: n = 7; 2 × 10⁷ PFU: n = 9). D, Pie charts represent the functionality of specific T cells to VSV-N peptide pools at day 28 following immunization. Shown are the proportions of VSV-N–specific memory CD8+ (left) and CD4+ (right) cells that produce any combinations of the 3 measured cytokines. Pie charts represent the mean value of 9 subjects from the high-dose cohort. E, Cytotoxic T-lymphocyte (CTL) response following stimulation with VSV-N peptides. Flow cytometry analysis of the degranulation marker CD107a in the CD8+ T-cell subset (3 × 10⁵ PFU: n = 10; 3 × 10⁶ PFU: n = 5; 2 × 10⁷ PFU: n = 8). The magnitude of CTL responses revealed significant intergroup differences on days 28 and 56 (Mann–Whitney–Wilcoxon test, P = .0045 and P = .0095, respectively). Comparing T-cell responses following VSV-N peptide stimulation revealed an increased response to VSV-N peptides in 3 vaccinees, showing induced cytokine or CD107a expression in CD8+ or CD4+ T cells. Box and whiskers show minimum to maximum; line shows the median. Statistical analysis was performed with Mann–Whitney–Wilcoxon test (*P < .05). Green: 3 × 10⁵ PFU; blue: 3 × 10⁶ PFU; red: 2 × 10⁷ PFU.

