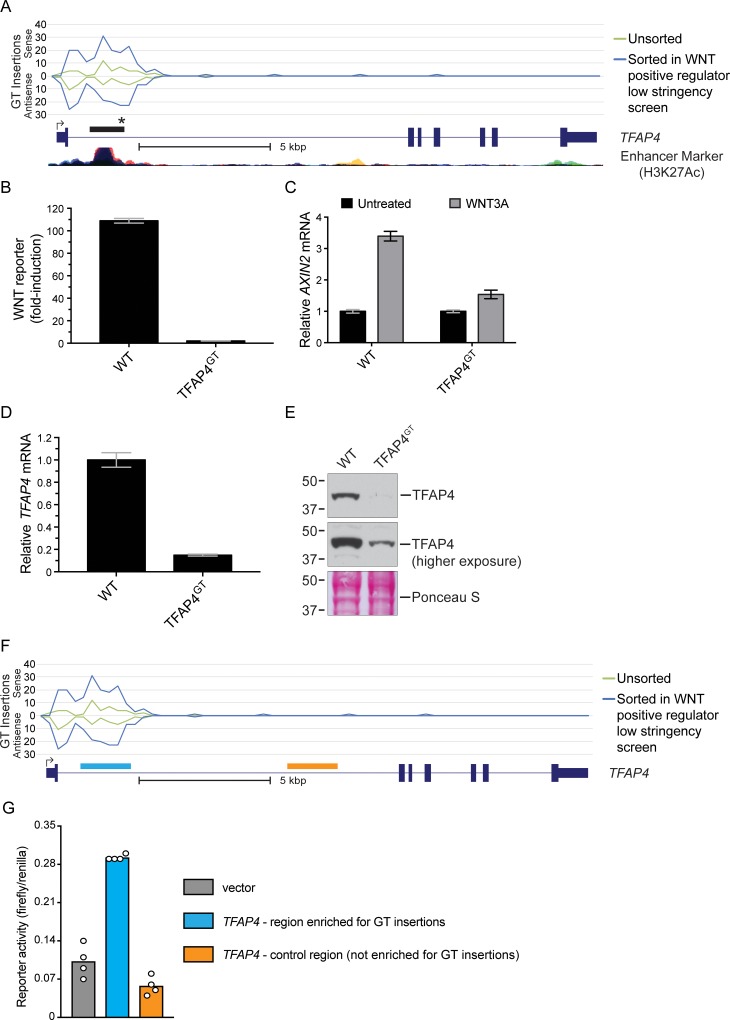
Fig 4. Antisense GT insertions in the first intron of TFAP4 disrupt a transcriptional enhancer element and impair WNT signaling.
(A) The histogram indicates the number and orientation of GT insertions mapped to TFAP4 in unsorted cells and in the sorted cells from the WNT positive regulator low stringency screen. Values above the horizontal line labeled “0” indicate sense insertions relative to the coding sequence of the gene, and values below it indicate antisense insertions. The x-axis represents contiguous 250 bp bins to which insertions were mapped (Chromosome 16, 4257249–4273000 bp). Insertions mapped for the different cell populations indicated in the legend are depicted by traces of different colors. A RefSeq gene track for TFAP4 (following UCSC genome browser display conventions, described in the legend of Fig 2A) and an ENCODE track for histone3-lysine27-acetylation, a marker for enhancer activity (taken from the UCSC genome browser), are shown underneath the graph. The black rectangle above the gene track indicates the location of the bin identified in the antisense intronic insertion enrichment analyses of both the WNT positive regulator low stringency and high stringency screens. The black star denotes the position of the antisense GT insertion (located at NC_000016.13:g.4271036_4271037insGenetrap (Dec.2013: hg38, GRCh38) [10]; see S2 File) in the TFAP4GT clonal cell line used for further characterization. A scale bar is provided beneath the gene track for reference. (B) Fold-induction in WNT reporter (median +/- standard error of the median (SEM) EGFP fluorescence from 10,000 cells) following treatment with 50% WNT3A conditioned media (CM). (C) AXIN2 mRNA (average +/- standard deviation (SD) of AXIN2 mRNA normalized to HPRT1 mRNA, each measured in triplicate qPCR reactions) relative to untreated cells. Where indicated, cells were treated with 50% WNT3A CM. (D) TFAP4 mRNA (average +/- SD of TFAP4 mRNA normalized to HPRT1 mRNA, each measured in triplicate qPCR reactions) relative to WT HAP1-7TGP cells. (E) Immunoblot of TFAP4. The middle panel shows a higher exposure of the same blot shown in the top panel, and the bottom panel displays Ponceau S staining of the same blot as a loading control. Molecular weight standards in kiloDaltons (kDa) are indicated to the left of each blot. (F) Histogram of GT insertions mapped to TFAP4 as in (A), with blue and orange boxes depicting the regions within the first intron tested in the transcriptional reporter assays shown in (G). GT insertions were enriched in the genomic region marked in blue (Chromosome 16, 4270498–4271890 bp) but were not enriched in a nearby control region marked in orange (Chromosome 16, 4264430–4265871 bp). (G) Luciferase reporter activity (ratio of firefly to renilla luciferase) in extracts of WT HAP1-7TGP cells transfected with a firefly luciferase gene driven by a minimal promoter alone (vector control, grey bar) or by the same minimal promoter with either of the two regions of TFAP4 shown in (F) cloned upstream (blue and orange bars). Renilla luciferase was driven by a constitutive promoter and serves as a control to normalize for differences in transfection. Bars show the average firefly to renilla luciferase ratio from 4 replicate wells, and circles indicate the ratio for each replicate.

