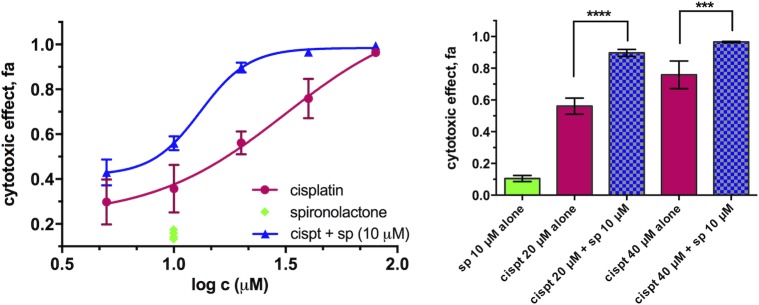
Fig 8. Cytotoxicity of cisplatin alone and in combination with spironolactone in PANC-1 cells after 72 h of exposure.
Left: concentration effect curves and Right: bar graphs of selected concentrations. Data is presented as mean ± SD from 4 replicates (combination) or 8 replicates (drugs alone) per concentration (****p < 0.0001, ***p < 0.001, determined by unpaired t test with Welch’s correction). Statistical analysis, curve fitting and graphs are prepared with GraphPad Prism 7.

