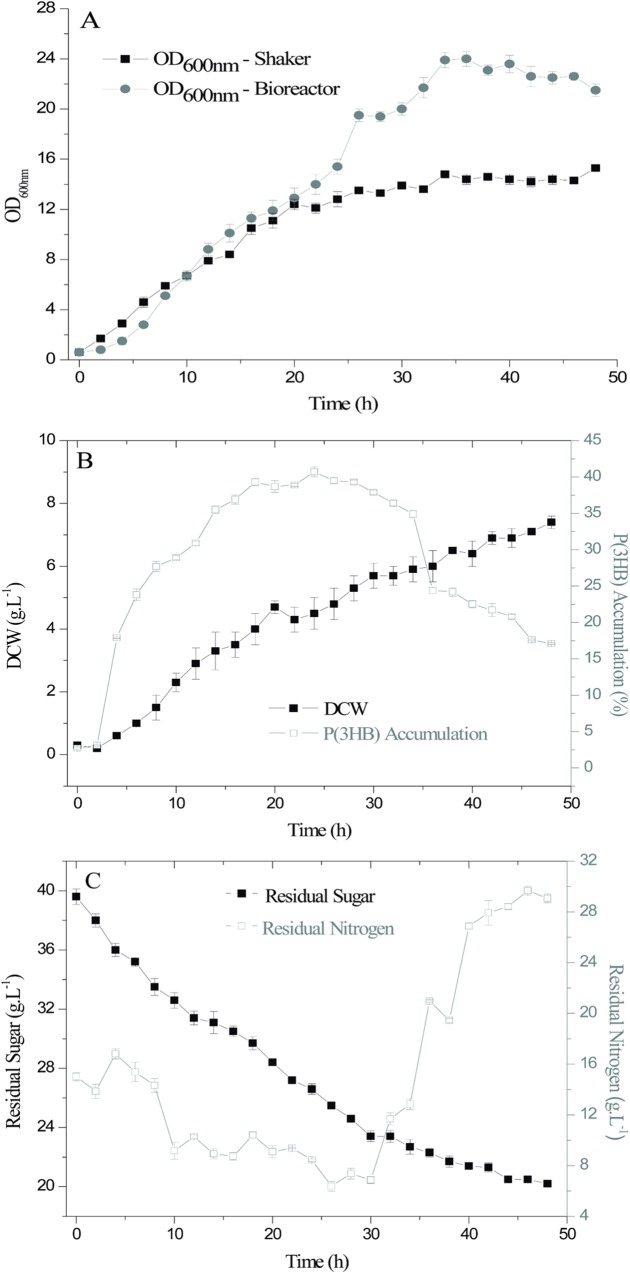
Fig 1. Growth curves of the R. solanacearum RS strains, P(3HB) accumulation and sugar and nitrogen residuals.
(A) shaker and bioreactor, cellular concentration expressed as OD600nm; (B) bioreactor, dry cellular weight (DCW) and P(3HB) accumulation (g.L-1); (C) bioreactor, sugar and nitrogen residuals during 48 h (g.L-1).

