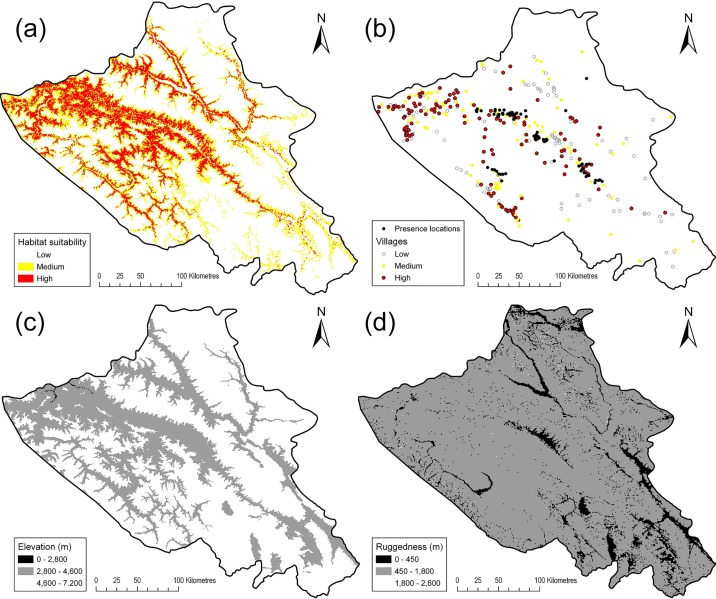
Fig 2. Spatial visualisation of snow leopard habitat suitability model and key environmental variables in Ladakh.
(a) Distribution of presence locations (black points; n = 83) and villages across high (red points; n = 131), medium (yellow points; n = 104) and low (white points; n = 90) snow leopard habitat suitability. (b) Snow leopard habitat suitability map. (c) Elevation categorised into below optimal (black; 0 m– 2,800 m), optimal (grey; 2,800 m– 4,600 m), and above optimal (white; 4,600 m– 7,200 m). (d) Ruggedness categorised into below optimal (black; 0 m– 450 m), optimal (450 m– 1,800 m), and above optimal (white; 1,800 m– 2,600 m).

