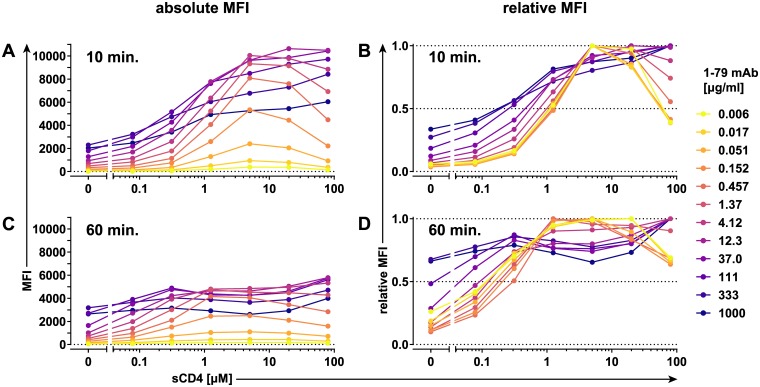
Fig 1. Triggering conformational changes in cell surface–expressed BaL.01 Env by sCD4.
HEK 293T cells expressing BaL.01 Env were stained with indicated concentrations of V3 crown-directed mAb 1–79 in the presence of increasing concentrations of two-domain sCD4 for 10 minutes (A, B) or 60 minutes (C, D). The amount of antibody bound to the cell surface was quantified by flow cytometry. Dead cells were excluded from analysis, and background signal from MuLV Env–expressing control cells was subtracted. MFI staining curves (A, C) or MFI staining curves normalized to their maxima (relative MFI staining curves) (B, D) are plotted for every antibody concentration. Histogram plots of the event distributions underlying the above MFI values are depicted in S1 Fig. Data represent a single experiment. Env, envelope glycoprotein; HEK, human embryonic kidney; mAb, monoclonal antibody; MFI, mean of fluorescence intensity; MuLV, murine leukemia virus; sCD4, soluble CD4; V3, third hypervariable.

