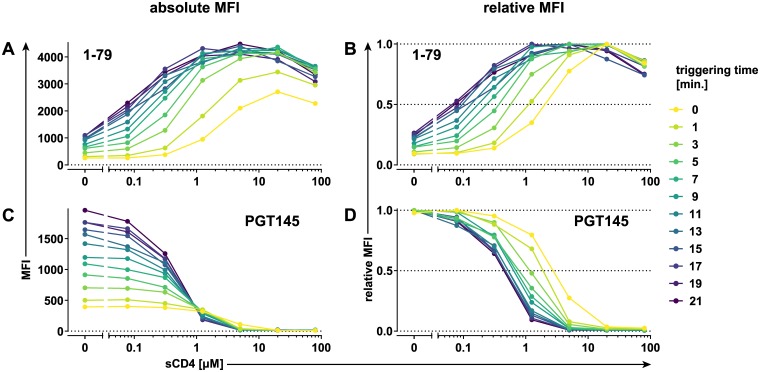
Fig 2. Time resolution of on-cell sCD4 triggering to define basal epitope exposure curves.
Time resolution of on-cell sCD4 triggering of BaL.01 Env. Binding efficacy of V3 crown mAb 1–79 (A, B) and V2 apex bnAb PGT145 recognizing a quaternary epitope (C, D) (both at 0.1 μg/ml) in response to increasing sCD4 at different time intervals. MFI staining curves (A, C) or MFI staining curves normalized to their maxima (relative MFI staining curves) (B, D) derived as described in Fig 1 are plotted for all individual time points. Histogram plots of the event distributions underlying the above MFI values are depicted in S2 Fig. Data represent a single experiment. bnAb, broadly neutralizing antibody; Env, envelope glycoprotein; mAb, monoclonal antibody; MFI, mean of fluorescence intensity; sCD4, soluble CD4; V2, second hypervariable; V3, third hypervariable.

