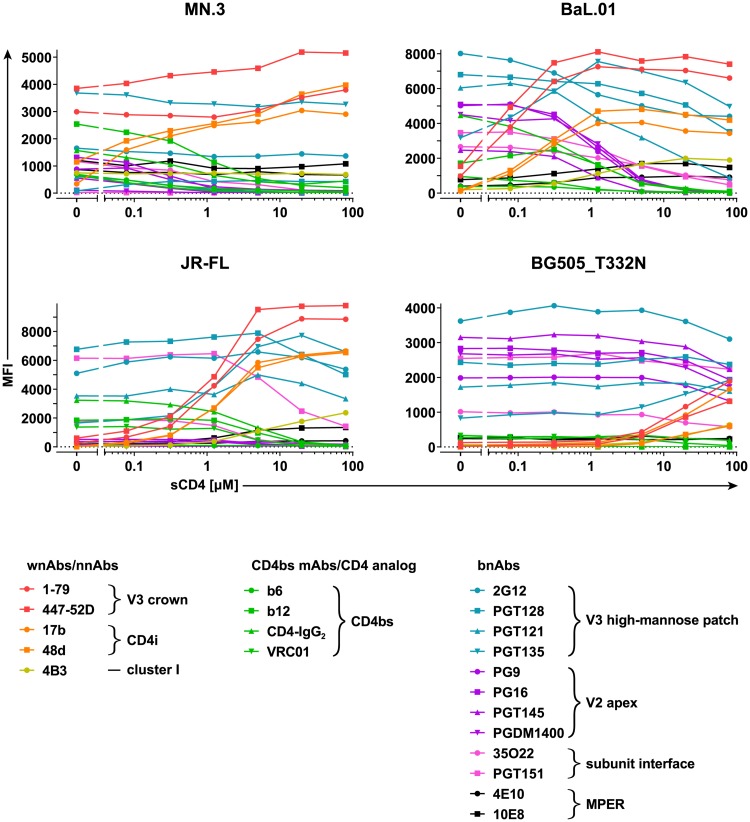
Fig 4. Comparison of the antigenic profiles and CD4-unbound state stability of divergent Envs.
On-cell sCD4 triggering of MN.3, BaL.01, JR-FL, and BG505_T332N Envs and assessment of antibody/inhibitor binding at 10 μg/ml with a 20-minute triggering step. MFI staining curves were derived as described in Fig 1. Respective relative MFI staining curves are depicted in S7 Fig and histogram plots of the event distributions in S8 Fig. Data represent a single experiment. BG505_T332N, BG505.W6M.ENV.C2_T332N; CD4bs, CD4 binding site; CD4i, CD4-induced site; Env, envelope glycoprotein; mAb, monoclonal antibody; MFI, mean of fluorescence intensity; MPER, membrane-proximal external region; nnAb, nonneutralizing antibody; sCD4, soluble CD4; V2, second hypervariable; V3, third hypervariable; wnAb, weakly neutralizing antibody.

